Como você pode garantir que suas estratégias de colaboração em equipe são eficazes se você não está medindo sua taxa de sucesso?
Você provavelmente está bem ciente da importância da colaboração em equipe. Como resultado, você explorou e decidiu implementar algumas estratégias para melhorar a colaboração dentro da sua própria equipe. Se sim, seu próximo passo deve ser medi-la, a fim de rastrear o sucesso das estratégias que você implementa.
Neste guia, você encontrará alguns dos métodos úteis para avaliar a colaboração da equipe, com ênfase nas métricas de colaboração que você precisa monitorar.

O que são métricas de colaboração?
Métricas de colaboração são indicadores usados para avaliar a eficácia e eficiência da colaboração em uma organização.
Na prática, medir a colaboração em organizações modernas envolve quantificar e interpretar as mudanças no desempenho da equipe.
Usando Indicadores-chave de desempenho (KPIs*), damos à noção abstrata de colaboração em equipe alguns recursos mensuráveis. *Embora Indicadores-Chave de Desempenho (KPI, do inglês Key Performance Indicators) seja traduzido como ICD, a sigla KPI é mais amplamente utilizada no Brasil para manter a consistência com padrões internacionais.
Então, coletamos os dados e os interpretamos.
Finalmente, podemos avaliar nossos resultados e decidir sobre um curso de ação posterior.
Por que você deve medir a colaboração da equipe
“Quando o desempenho é medido, o desempenho melhora. Quando o desempenho é medido e relatado, a taxa de melhoria acelera.” – Lei de Pearson
Pearson foi um estatístico da virada do século que observou a importância de definir métricas de colaboração e monitorar o progresso há mais de um século. Sua lei está se tornando cada vez mais pertinente no contexto do trabalho moderno, pois as indústrias competitivas exigem que as empresas avaliem precisamente seu desempenho. Caso contrário, correm o risco de perder sua vantagem competitiva — e, com ela, sua sustentabilidade.
Hoje em dia, as equipes são quase onipresentes no local de trabalho. Como resultado, existe uma relação direta entre a qualidade da colaboração da equipe e a qualidade dos produtos e serviços oferecidos pela empresa. Diante disso, fica claro que, assim como medimos a qualidade da saída, também devemos medir o sucesso da colaboração. Aqui podemos resumir alguns dos benefícios de usar métricas de colaboração para rastrear a colaboração da equipe:
- Aumento da produtividade. O acompanhamento do desempenho torna as pessoas mais conscientes do que influenciam seus níveis de produtividade. Com acesso a esses dados, os funcionários podem se concentrar em áreas que precisam de melhorias.
- Metas claras. Medir o desempenho facilita a definição de metas claras e realistas para os funcionários. Ter objetivos bem definidos ajuda as pessoas a se sentirem mais motivadas a se esforçar, além de sentir uma maior sensação de realização quando atingem seus objetivos.
- Responsabilidade pessoal. Ter dados precisos para mostrar as contribuições de cada pessoa abre espaço para a responsabilidade pessoal. Isso dá às pessoas a oportunidade de ver seus esforços fazendo a diferença para a causa comum. Além disso, torna difícil culpar alguém pelo desempenho ruim de outra pessoa. Análise dos impactos no desempenho financeiro.
- Ao medir a colaboração da equipe, podemos tirar conclusões sobre seu efeito no desempenho financeiro. No entanto, também podemos fazer isso ao contrário e rastrear algumas das flutuações financeiras até mudanças nas taxas de sucesso da colaboração. Ambas as direções de análise podem apontar para problemas que exigem atenção.
As 3 etapas a serem seguidas para medir a colaboração da equipe
Quantificando a colaboração. Para determinar de que forma e em que medida as influências externas alteram o desempenho da equipa, primeiro precisamos quantificar essas mudanças. Fazemos isso selecionando primeiro um conjunto de ações que acreditamos contribuir para a colaboração da equipe. A seguir, atribuímos valores mensuráveis a essas ações. Por fim, definimos metas específicas, em relação às quais podemos acompanhar o progresso.
- Coletando dados. Após a definição inicial da meta e da métrica, abordamos a tarefa de medir e coletar dados. Para fazer isso, podemos contar com as impressões relatadas pelos próprios funcionários ou com os dados que coletamos por meio do monitoramento de atividades on-line e presenciais. Obviamente, também podemos combinar as duas abordagens.
- Uso eficaz dos dados coletados. Após a definição inicial de metas e métricas, abordamos a tarefa de medir e coletar dados. Para fazer isso, podemos confiar em impressões auto-relatadas de funcionários ou em dados que coletamos monitorando atividades online e presenciais. Obviamente, também podemos combinar as duas abordagens.
- Uso efetivo dos dados coletados. Medir a colaboração não serve para nada se não aplicarmos nossas conclusões para melhorar o sucesso da colaboração. Portanto, temos que nos esforçar para interpretar e usar adequadamente os dados para atingir áreas que precisam de melhoria.
Como quantificar a colaboração da equipe?
Quantificar é transformar conceitos abstratos em valores numéricos tangíveis. No contexto da colaboração em equipe, isso só pode ser feito atribuindo valores às ações que consideramos importantes para a colaboração. Por exemplo, podemos contar o número de vezes que os membros da equipe trocam e-mails durante um determinado período de tempo.
Devido à natureza complexa da colaboração, as métricas que usamos para medi-la devem ser ajustadas de forma a focar no fluxo do processo. Portanto, o foco principal da medida deve ser a forma como as pessoas colaboram. Isso inclui observar os efeitos emocionais do trabalho colaborativo, além das formas como os trabalhadores contribuem para ele.
Um tipo comumente utilizado de medidas quantitativas são os Indicadores Chave de Desempenho (KPIs). Podemos usar KPIs para acompanhar o progresso em direção aos objetivos definidos. Em seguida, usamos os dados que coletamos para fazer ajustes em nossas estratégias de colaboração em equipe.
Mas primeiro, vamos começar nos aprofundando um pouco mais no conceito de KPIs e como eles se relacionam à medição da colaboração da equipe.
Quais métricas de colaboração de KPI são relevantes para medir a colaboração em uma equipe?
Como já mencionamos, os Indicadores-chave de desempenho (KPIs) são conjuntos de valores mensuráveis utilizados para indicar o nível de realização dos objetivos da empresa.
Você pode pensar nos KPIs como indicadores compostos por dados, medindo a taxa de cumprimento de metas específicas da empresa.
De acordo com sua função, podemos colocar os KPIs em 4 categorias amplas: KPIs de desempenho financeiro, KPIs de qualidade de processos internos, KPIs de satisfação do cliente e KPIs de satisfação dos funcionários.
KPIs de desempenho financeiro
Os KPIs financeiros usam métricas que se preocupam com todas as formas de atividades relacionadas a dinheiro dentro de uma organização. Assim, eles podem medir o crescimento das receitas, margens de lucro, despesas, gestão de caixa, etc. Além disso, os KPIs financeiros podem ser usados para medir o desempenho da empresa em comparação com outras empresas do mesmo setor.
KPIs de desempenho de processos internos
KPIs que avaliam a qualidade dos processos internos focam no desempenho operacional dentro da empresa. Esses KPIs medem, por exemplo, a quantidade de produtos bem-sucedidos vs. produtos mal sucedidos ou o tempo necessário para entregar um produto ou serviço completo.
KPIs de satisfação do cliente
Os KPIs de satisfação do cliente medem o feedback dos clientes. Portanto, eles se concentram em monitorar o índice de satisfação do cliente, as taxas de retenção de clientes ou a eficiência das equipes de suporte ao cliente.
KPIs de satisfação dos funcionários
Para medir a satisfação dos funcionários, utilizamos KPIs que avaliam como os funcionários vivenciam o ambiente de trabalho. Para isso, observamos o índice de engajamento e satisfação dos funcionários, as taxas de absenteísmo e outras métricas relevantes.
Como medir o sucesso da colaboração com KPIs
Precisamos de medidas objetivas para quantificar e avaliar o desempenho dos colaboradores. Uma solução para isso é usar indicadores-chave de desempenho. Ao medir o sucesso colaborativo com KPIs, precisamos ter em mente que as métricas de colaboração que escolhemos moldam a nossa compreensão daquilo que medimos.
Em outras palavras, se escolhermos métricas que não impactem o nosso assunto da maneira que esperamos, inevitavelmente interpretaremos os dados de forma errada. No final, depois de todo este esforço para avaliar e medir a colaboração, ficaremos com conjuntos de dados inúteis.
Para evitar que isso aconteça, podemos utilizar os critérios SMART para determinar boas escolhas de indicadores de desempenho. Esses indicadores devem ser:
✅ (S)Específicos — Os KPIs precisam apontar precisamente as áreas que necessitam de melhoria.
✅ (M) Mensuráveis — Os KPIs devem ser capazes de quantificar e acompanhar o progresso.
✅ (A) Alcançáveis — Os KPIs devem ser realistas e ajustados às circunstâncias.
✅ (R) Relevantes — Os KPIs devem ter um impacto direto nos objetivos.
✅ (T) Temporais — Os KPIs precisam ter uma duração limitada de operação.
A seguir, apresentaremos alguns dos KPIs específicos que você pode usar para medir as metas e habilidades de colaboração em equipe, a colaboração entre equipes, bem como a eficácia das ferramentas de colaboração em equipe.
Como medir metas de colaboração
Quando uma equipe tem a tarefa de criar produtos ou serviços, a melhor medida das metas de colaboração da equipe é a qualidade desses produtos. Para produzir um produto de alta qualidade, uma equipe tem de ter um bom desempenho, o que significa que os seus membros têm de colaborar com sucesso.
A qualidade objetiva dos produtos e serviços, num mercado livre, é medida pelos ganhos financeiros que criam, bem como pelo feedback dos clientes.
Assim, podemos medir as metas de colaboração usando KPIs financeiros que rastreiam o lucro líquido, a taxa de crescimento da receita e a receita média por usuário. Além disso, avaliamos a satisfação do cliente usando os seguintes KPIs: o Índice de Satisfação do Cliente, a Taxa de Retenção de Clientes e o Net Promoter Score.
Alinhe as metas de colaboração no Pumble
Lucro líquido
Podemos calcular o lucro líquido de uma organização subtraindo o custo de produção da receita total gerada pelas vendas. Este KPI é geralmente considerado a medida mais importante do sucesso empresarial. Todas as empresas buscam um excedente de lucro líquido, o que as coloca em uma posição favorável para investir no crescimento.
Taxa de crescimento da receita
A receita de uma empresa é a quantidade de dinheiro que ela adquire durante um determinado período de tempo. Pode ser usado para medir a taxa de sucesso no alcance dos objetivos definidos. Porém, esse número não leva em consideração a saída de despesas.
A definição diz que a taxa de Crescimento da Receita é calculada comparando o aumento ou a diminuição nas vendas que uma empresa faz em um determinado período de tempo. Essa taxa geralmente é calculada anualmente e é expressa em porcentagens.
Receita média por usuário (ARPU)
De acordo com a definição, Receita por Cliente é calculada dividindo a receita total pelo número de clientes, usuários ou assinantes. O ARPU é usado para medir a capacidade de geração de receita da empresa no nível de cada cliente. Este KPI é útil quando se trata de previsões financeiras, comparações com empresas semelhantes, bem como descobrir qual nível de clientes traz mais lucro.
Índice de satisfação do cliente
O Índice de Satisfação do Cliente presume que os clientes que estão satisfeitos com bens ou serviços são mais propensos a comprar novamente. Além disso, esses clientes desenvolvem fidelidade à marca e são mais propensos a deixar um feedback positivo.
Em termos de vantagem financeira, manter um bom relacionamento com os clientes existentes é muito mais barato do que adquirir novos.
O Índice de Satisfação do Cliente geralmente é derivado de pesquisas, que pontuam critérios como valor percebido, expectativas e mais. Esses valores são então combinados em uma única pontuação numérica, usada para determinar o nível geral de satisfação ou insatisfação.
Taxa de retenção de clientes
Seguindo junto com o conceito de fidelidade à marca do cliente, podemos encontrar a Taxa de Retenção de Clientes aplicável. Como é considerada um sinal de boa qualidade de produção, a taxa de retenção de clientes mede a proporção de compradores recorrentes.
O Client Retention Ratio é geralmente calculado mensalmente. A fórmula usada para calculá-lo parece com isso:
CRR = ( E – N ) / S
Onde os valores representados são:
⏮ S — Número de clientes no início de um determinado período
🆕 N — Número de novos clientes
⏭ E — Número de clientes no final de um determinado período
Para colocar esta fórmula em palavras, obtemos a taxa de retenção de clientes subtraindo primeiro o número de novos clientes do número de clientes no início de um período. Depois, dividimos o número que obtivemos pelo número de clientes que tínhamos no início do referido período.
Net Promoter Score (NPS)
O NPS mede a experiência do cliente e pode ser usado para prever o crescimento dos negócios. O NPS usa uma escala de 0 a 10 para avaliar a satisfação do cliente, fazendo a seguinte pergunta:
"Qual é a probabilidade de você recomendar nossa empresa/produto/serviço a um amigo ou colega?"
Com base na pontuação que os clientes dão como resposta a esta pergunta, podemos classificá-los em três categorias:
- Promotores (pontuação 9-10). Promotores são clientes entusiasmados em compartilhar sua satisfação com o produto ou serviço. Estas são as pessoas leais à marca, com maior probabilidade de serem clientes recorrentes e de impulsionar o crescimento, recomendando o produto ou serviço às pessoas ao seu redor.
- Passivos (pontuação 7-8). Na categoria dos passivos, temos os clientes moderadamente satisfeitos com o produto, mas não entusiasmados em recomendá-lo a terceiros. Os clientes passivos têm maior probabilidade de estar abertos a ofertas dos concorrentes.
- Detratores (pontuação 0-6). Detratores são clientes insatisfeitos com os produtos ou serviços. Esses clientes podem impedir o crescimento e minar a imagem da marca ao compartilhar impressões negativas.
Calculamos o NPS subtraindo a porcentagem de Detratores da porcentagem de Promotores.
Como medir habilidades de colaboração
Podemos definir habilidades de colaboração como aquelas características pessoais que permitem que você colabore com sucesso com outras pessoas. Como essas características são únicas para cada indivíduo, elas são muito abstratas para serem medidas diretamente.
Em vez disso, avaliamos a expressão das competências colaborativas na forma de Variação do Cronograma do Projeto da equipe, que indica quão bem as pessoas combinaram seus esforços para realizar os objetivos planejados. Além disso, utilizamos KPIs que medem como os funcionários utilizam as suas competências colaborativas para moldar o clima geral no local de trabalho. Fazemos isso avaliando os índices de engajamento e satisfação dos funcionários.
Variação do cronograma do projeto
A variação do cronograma do projeto é utilizada para indicar se o desempenho realizado está abaixo, igual ou acima do desempenho planejado. Este KPI pode ser medido em um ponto específico ou comparando o desempenho em diferentes períodos.
Nós calculamos a Variância do Cronograma do Projeto subtraindo o valor planejado do valor real, ganho. A unidade de medida mais comum é a moeda, e deve ser a mesma para ambos os valores (planejado e ganho).
Índice de engajamento do funcionário
O Engajamento dos Funcionários depende do nível de conexão mental e emocional que os funcionários sentem em relação aos membros de sua equipe e ao ambiente de trabalho. Este KPI mede como os funcionários percebem o local de trabalho e os sentimentos que eles têm em relação a ele.
Com base no nível de envolvimento pessoal, podemos dividir os funcionários em quatro categorias:
- Funcionários ativamente engajados ( 5 – 15 % ). São funcionários apaixonados e altamente ativos. Essas pessoas sentem um profundo sentido de significado e propósito em seu trabalho, o que se reflete em suas realizações. Na verdade, sua paixão é tão abundante que transborda e motiva as pessoas ao seu redor a melhorar seu próprio desempenho. Funcionários altamente engajados são positivos, confiáveis, produtivos e dedicados ao seu trabalho.
- Funcionários engajados (20 a 25 %). Os funcionários que consideramos engajados mantêm um nível constante de comprometimento e uma perspectiva positiva em relação ao seu trabalho. Eles estão focados e trabalham de forma diligente, proporcionando uma base confiável para a empresa.
- Funcionários um pouco desinteressados (~ 50 %). Poderíamos descrever a maneira como essas pessoas trabalham como adequadas. Cumprem o mínimo absoluto de suas responsabilidades, estabelecendo um bloqueio mental assim que termina o horário de trabalho. Geralmente, estas pessoas podem por vezes experimentar breves períodos de envolvimento, mas no geral, não encontram nenhum significado mais profundo no seu trabalho.
- Funcionários ativamente desengajados (5 a 15 %). Os trabalhadores que estão ativamente desligados sentem uma insatisfação profunda com o trabalho. Basicamente, eles só aparecem para receber o contracheque. São essas pessoas que costumam fofocar, falar mal da empresa e, de certa forma, tentam ser o mais improdutivas possível sem serem demitidas. Como resultado, esses funcionários atrapalham o fluxo de trabalho e tornam a experiência muito mais desagradável para aqueles que estão ao seu redor.
Usamos pesquisas para medir os níveis de envolvimento dos funcionários. Eles são criados de forma a permitir que os funcionários avaliem e relatem suas próprias impressões sobre o espaço de trabalho. Ou seja, eles colocam questões que podem ser respondidas usando uma escala numérica. Essas respostas combinadas compõem o índice de engajamento.
Índice de satisfação do funcionário
O Índice de Satisfação do Funcionário mede o nível de contentamento que os funcionários sentem em relação às suas funções de trabalho. Como pessoas felizes são 13% mais produtivas, há uma ligação clara entre os níveis de satisfação dos funcionários e o desempenho empresarial bem-sucedido.
Este KPI é medido da mesma forma que o índice de engajamento. Assim, é realizada uma pesquisa para que os trabalhadores relatem seu nível de satisfação.
Como medir a colaboração entre equipes
KPIs importantes para as relações dentro das equipes também podem ser usados para medir o sucesso da colaboração entre equipes. Isso significa que podemos utilizar os mesmos KPIs que usamos para medir as habilidades de colaboração quando se trata de medir a colaboração entre equipes.
Além disso, algumas métricas de colaboração adicionais são introduzidas para destacar os aspectos organizacionais da colaboração entre equipes. Portanto, utilizamos o Índice de Qualidade do Gerente e o Índice de Efetividade de RH para obter uma estimativa mais precisa da qualidade da colaboração entre as equipes.
Índice de qualidade do gerente
Esse índice mede a satisfação geral dos funcionários com a equipe de gestão. Como a qualidade percebida dos gestores influencia diretamente a satisfação e o envolvimento dos funcionários, também tem um grande impacto nos níveis de produtividade dos trabalhadores.
Este KPI é uma combinação de opiniões sobre a personalidade, habilidades e conhecimentos do gerente. Geralmente, ele é definido, novamente, por meio de pesquisas de autoavaliação feitas com os funcionários.
Índice de efetividade de RH
O índice de efetividade de RH é uma medida composta por diversas métricas financeiras e de recursos humanos. Alguns deles incluem relatórios sobre retorno sobre investimento, rotatividade e produtividade da mão de obra, satisfação dos funcionários, entre outros.
O recrutamento e o treinamento de funcionários podem determinar as taxas de colaboração. Isso ocorre porque personalidades semelhantes tendem a colaborar com mais facilidade e o RH tem a tarefa de escolher pessoas que se encaixem na equipe desejada. Além disso, o fato de um funcionário ter passado por um treinamento e a sua qualidade, podem fazer a diferença na comunicação diária. Ao receberem o treinamento adequado, os colaboradores têm à disposição um conjunto amplo de técnicas de comunicação.
Como medir a eficácia das ferramentas de colaboração
Acompanhar as atividades dos membros da equipe torna as pessoas mais produtivas.
Por exemplo, equipes remotas produzem produtos e serviços de forma mais eficiente, ao mesmo tempo que utilizam uma ferramenta que lhes permite estar cientes do que os outros estão a fazer. O aumento da produtividade é medido em todas as métricas de colaboração, pois afeta todos os níveis e etapas da produção.
Por exemplo, um software de chat em equipe pode ser uma ferramenta de colaboração eficaz, pois permite comunicação e compartilhamento de informações rápidas e simples.
Alguns KPIs que podemos usar para medir a eficácia das ferramentas de colaboração incluem o uso geral das ferramentas de colaboração, bem como seus principais usuários.
Uso geral
Medir métricas como comentários, curtidas, compartilhamentos, etc., fornece uma indicação geral do número de pessoas que usam a ferramenta, monitorado ao longo do tempo. Ter acesso a este tipo de dados permite-nos observar tendências de utilização e o tipo de conteúdo que os colaboradores visualizam e partilham. Além disso, temos informações sobre quem são as pessoas com maior probabilidade de colaborar estreitamente entre si e em que medida.
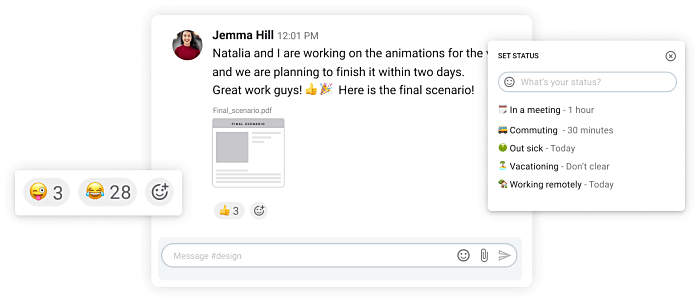
Algumas tecnologias facilitam a visualização de como as pessoas reagem às informações compartilhadas. Além disso, poder ver o status online de uma pessoa facilita o monitoramento das horas de trabalho produtivo, especialmente para equipes remotas.
Principais usuários
Muitas vezes, dentro de uma organização, descobrimos que há um pequeno número de funcionários que utilizam ferramentas de colaboração consideravelmente mais do que outros. Geralmente, esses são os funcionários ativamente engajados que descrevemos anteriormente. Estes são os trabalhadores apaixonados e entusiasmados, que provavelmente influenciarão os outros.
Ver quem são os usuários mais proativos torna mais fácil identificar e investir em pessoas com mais influência e potencial de crescimento.
Tipos de dados que os KPIs medem e como coletá-los
Os principais indicadores de desempenho podem medir dados subjetivos e objetivos. Por “subjetivos” entendemos as autoavaliações dos funcionários e por “objetivos” temos em mente os dados coletados por meio de observação e rastreamento externo. Existem diferentes métodos usados para medir esses dois tipos de dados.
Como coletar dados subjetivos de KPI
Tradicionalmente, as pesquisas são usadas para tornar mensuráveis os dados subjetivos. Portanto, o processo de coleta de dados subjetivos começa quando fazemos perguntas às pessoas para determinar a sua compreensão e avaliação da situação. Em seguida, eles são solicitados a responder indicando um ponto em uma escala, que é usada para atribuir valores numéricos a diversas medidas de desempenho.
Por exemplo, uma forma comum de medir o nível subjetivo de compreensão da situação é pedir aos participantes da pesquisa que avaliem até que ponto compreendem a situação. Outra métrica comumente usada é até que ponto os participantes dizem gostar ou não de estratégias de colaboração, das mudanças feitas nelas ou do impacto delas no trabalho diário.
Existem dois problemas principais m confiar em dados baseados em pesquisas. Primeiro, as pesquisas não são facilmente escaláveis em grandes organizações. Além disso, devido aos altos custos e à necessidade de aprovação do administrador, geralmente capturam dados apenas dentro de uma única entidade ou de várias entidades menores. Em segundo lugar, os inquéritos são, por definição, tendenciosos. As opiniões dos participantes são distorcidas por preconceitos pessoais e limitadas a uma determinada esfera de atividade.
4 Pesquisas que podemos usar para medir dados subjetivos de KPI
Aqui temos uma lista de quatro pesquisas que podemos usar para medir o sucesso da colaboração em diferentes contextos:
- A Pesquisa de Colaboração é usada para medir as percepções de colaboração. A Pesquisa de Colaboração pode fornecer às organizações insights sobre onde os funcionários percebem que as coisas estão indo e quais áreas acreditam que é necessário um foco adicional. Esta pesquisa utiliza 21 itens diferentes relevantes para a eficácia e operações da colaboração.
- A Escala de Níveis de Colaboração mede o grau de colaboração dentro de uma parceria ou coalizão. Esta pesquisa foi desenvolvida na Universidade do Kansas e é usada principalmente para medir a colaboração entre parceiros financiadores. Os participantes podem relatar o nível de colaboração percebida, que é então agregado num nível médio de colaboração entre todos os entrevistados.
- PARTNER é uma ferramenta de análise de redes sociais projetada para medir e rastrear a colaboração entre pessoas e organizações. Foi concebido tendo em mente as redes e coligações de saúde rurais. Como tal, procura demonstrar como os membros da equipa estão ligados, como os recursos são aproveitados e trocados, quais são os níveis de confiança e as ligações dos resultados ao processo de colaboração.
- A Escala de Prática Colaborativa (CPS) foi projetada para medir práticas colaborativas relatadas por enfermeiros e médicos. Esta pesquisa pede aos participantes que avaliem as interações entre enfermeiros e médicos de acordo com o nível em que "permitem que o conhecimento e as habilidades de ambos os profissionais influenciem sinergicamente o cuidado prestado ao paciente".
Como coletar dados objetivos de KPI
Para contrastar com as medidas subjetivas autorrelatadas, temos medidas objetivas de desempenho. Estas são as informações que obtemos ao observar e acompanhar as atividades que consideramos importantes para o nosso assunto – neste caso, o sucesso da colaboração.
A intensidade da comunicação eletrônica e a troca de dados durante as reuniões são métricas de colaboração importantes quanto à natureza e às taxas de colaboração entre os funcionários. Ambos os tipos de dados podem revelar os tipos de colaboração envolvidos na interação, bem como as funções de trabalho e as características pessoais das pessoas com maior probabilidade de colaborar.
Mas a vantagem mais significativa de medir dados objetivos de KPI é a capacidade de acompanhar os níveis de produtividade e o seu efeito no desempenho financeiro.
As empresas usam vários tipos de software para monitorar a produtividade de seus funcionários, incluindo aplicativos de controle de tempo, software de gerenciamento de projetos e sistemas de mensagens de equipe.
Além do monitoramento direto de dados eletrônicos e de reuniões, existem métodos menos intrusivos de coleta de dados. Alguns deles incluem:
- Anotar conversas ouvidas sobre o tema colaboração
- Revisão de documentos preparados sobre o tema da colaboração
- Observar comportamentos que indicam como as pessoas se sentem em relação às práticas colaborativas
Como usar KPIs de forma eficaz
Quando você tem todos os resultados das medições de KPI à sua frente, qual é o próximo passo a ser dado? Uma linha de ação confiável e eficaz é elaborar estratégias de colaboração em equipe no futuro.
Depois de decidir seu curso de ação, você pode ter em mente algumas maneiras de usar KPIs de maneira eficaz.
A eficácia dos KPIs depende de como eles são implementados. Na verdade, se você pular esta etapa, todos os seus outros esforços poderão ser em vão. Não faz sentido definir KPIs se você não reservar um tempo para comunicá-los adequadamente aos membros de sua equipe. Caso contrário, você pode acabar na situação de ter estratégias perfeitas falhando completamente devido a falta de comunicação.
🎓 Para encontrar informações detalhadas sobre erros típicos de comunicação, confira nosso guia sobre as barreiras da comunicação eficaz.
Algumas etapas que você pode seguir para tornar possível o uso eficaz dos KPIs incluem: definir objetivos claros, compartilhar e atualizar informações e realizar análises regulares de desempenho.
Defina objetivos claros
Faça um esforço para desenvolver objetivos totalmente definidos. Isso significa que você deve se fazer uma série de perguntas:
- O que exatamente queremos alcançar?
- Que métodos queremos usar para atingir nossos objetivos?
- Como esses métodos funcionam no local de trabalho?
- Como acompanharemos o progresso dos métodos que escolhemos?
Com base em como você responde a essas perguntas, você pode desenvolver uma estratégia eficaz de colaboração em equipe, que abrangerá todos os aspectos importantes do sucesso da colaboração em equipe.
Compartilhe e atualize informações
Depois de definir seus objetivos, certifique-se de comunicá-los adequadamente à sua equipe. É fundamental garantir que todos estejam alinhados e cientes das metas de KPI para que possam trabalhar de forma coordenada na sua realização.
Além disso, à medida que forem feitas alterações em seus planos, atualize regularmente para que todos tenham tempo e espaço para se ajustar às novas direções.
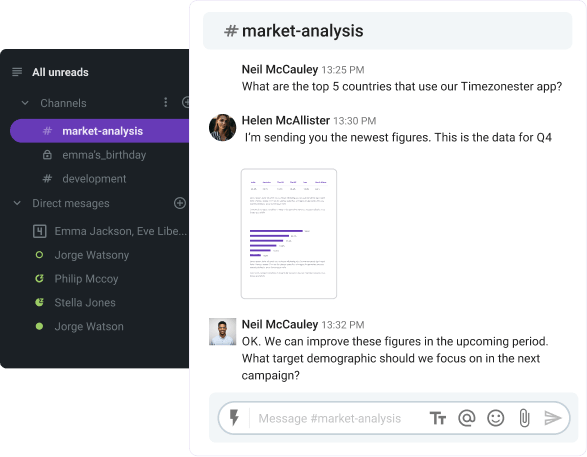
Compartilhe e peça atualizações pelo Pumble
Agende avaliações de desempenho regulares
À medida que o projeto avança em direção à conclusão de seus objetivos, é importante realizar avaliações regulares de desempenho. Isso garante que todos permaneçam informados sobre quais são as métricas relevantes e como estão sendo medidas.
Reserve um tempo para realizar pesquisas no início do projeto e em intervalos regulares durante toda a duração do projeto. Pergunte aos funcionários o que eles pensam e sentem sobre as mudanças que você implementa e como elas afetam a carga de trabalho e a produtividade diárias.
Melhore as métricas de colaboração com o Pumble
Deixar de avaliar o sucesso da colaboração ou usar métricas erradas para fazê-lo pode levar a práticas disfuncionais no local de trabalho.
Para garantir que a colaboração de sua equipe seja excelente, incentive o uso do Pumble!
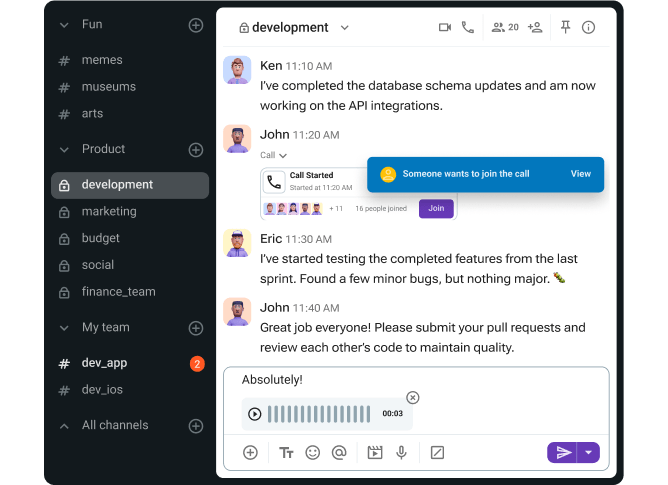
Pumble é uma ferramenta de colaboração em equipe que permite às organizações comunicar e coordenar perfeitamente seus esforços organizacionais.
O principal objetivo de medir a colaboração é descobrir como as pessoas colaboram. Com o Pumble, você terá uma visão clara dos efeitos emocionais da colaboração e de todas as maneiras pelas quais os funcionários individuais contribuem para isso.
Veja como o Pumble pode mudar a maneira como você monitora e mede a colaboração — inscreva-se gratuitamente hoje mesmo!
Como avaliamos esta publicação: Nossos escritores e editores monitoram as postagens e as atualizam quando novas informações ficam disponíveis, para mantê-las atualizadas e relevantes. Publicado: 23 de setembro de 2021
