Published: September 23, 2021
 How can you be sure your team collaboration strategies are effective if you aren’t measuring their rate of success?
You are probably well aware of the significance of team collaboration. As a result, you’ve explored and decided to implement some strategies to improve collaboration inside your own team. If so, your next step should be to measure team collaboration, in order to track the success of the strategies you implement.
In this guide, you will find some of the methods used for measuring team collaboration, with emphasis on the collaboration metrics you need to track.
What are collaboration metrics?
Collaboration metrics are measurements we use to gauge the effectiveness and efficiency of collaboration in an organization.
Measuring collaboration in modern organizations is done by quantifying and interpreting changes in team performance.
Using Key Performance Indicators (KPIs), we give the abstract notion of team collaboration some measurable features.
Then, we collect the data and interpret it.
Finally, we can assess our results and decide on a further course of action.
Why you should measure team collaboration
“When performance is measured, performance improves. When performance is measured and reported back, the rate of improvement accelerates.” – Pearson’s Law
Pearson was a turn-of-the-century statistician who noted the significance of setting collaboration metrics and tracking progress more than a century ago. His law is becoming increasingly pertinent within the context of modern work, as competitive industries require companies to precisely evaluate their performance. If not, they risk losing their competitive edge, and their livelihood along with it.
Today, work teams are almost ubiquitous in the workplace. As a result, there is a direct relationship between the quality of team collaboration and the quality of company products and services. When we take this into account, it becomes obvious that, just as we measure the quality of the output, we should also measure the success of collaboration. Here we can summarize some of the benefits of using collaboration metrics to track team collaboration:
- Increased productivity. Tracking performance makes people more aware of what influences their level of productivity. With access to this data, employees can focus on areas that need improvement.
- Clear targets. Measuring performance makes it easier to set clear and realistic targets for the employees. Having well-defined targets helps people feel more motivated to put in effort, as well as feeling a greater sense of accomplishment when they achieve their goals.
- Personal accountability. Having precise data to show each person’s contributions makes room for personal accountability. This gives people the opportunity to see their efforts making a difference to the common cause. Also, it makes it difficult to blame someone for someone else’s poor performance.
- Insight into effects on financial performance. When we measure team collaboration, we can draw conclusions about its effect on financial performance. However, we can also do this in reverse and trace back some of the financial fluctuations to changes in rates of collaboration success. Both directions of analysis can point to issues that require attention.
3 steps to take to measure team collaboration
At the outset of each endeavor, it is useful to break it apart into smaller objectives. When it comes to measuring collaboration success, we have three main goals: quantifying collaboration, collecting data used to measure collaboration, and the effective use of data we collect.
- Quantifying collaboration. In order to determine in which ways and to what extent external influences change team performance, we first need to quantify these changes. We do this by first selecting a set of actions we believe contribute to team collaboration. Next, we assign measurable values to these actions. Finally, we set specific goals, in relation to which we can track progress.
- Collecting data. After the initial goal and metric setting, we approach the task of measuring and collecting data. To do this, we can rely on self-reported employee impressions, or on data we collect by monitoring online and in-person activities. Obviously, we can also combine the two approaches.
- Effective use of collected data. Measuring collaboration serves no purpose if we do not apply our conclusions to improve the success of collaboration. Thus, we have to put effort into properly interpreting and using data to target areas in need of improvement.
How can you quantify team collaboration?
To quantify is to turn abstract concepts into tangible numerical values. Within the context of team collaboration, this can only be done by assigning values to actions we deem important in matters of collaboration. For example, we can count the number of times team members exchange emails over a certain period of time.
Due to the complex nature of collaboration, the metrics we use to measure it have to be adjusted in a way that focuses on the flow of the process. Therefore, the main focus of measuring collaboration should be on how people collaborate. This includes observing the emotional effects of collaborative work, in addition to the ways workers contribute to it.
A commonly used type of quantitative measurements of actions are Key Performance Indicators (KPIs). We can use KPIs to track progress towards set objectives. Then, we use the data we collect to make adjustments to our team collaboration strategies.
But first, let’s start by dwelling a bit deeper into the concept of KPIs and how they pertain to measuring team collaboration.
What KPI collaboration metrics are relevant for measuring collaboration in a team?
As we already mentioned, Key Performance Indicators (KPIs) are sets of measurable values used to indicate the level of achievement of company objectives.
You can think of KPIs as pointers made of data, gauging the rate of achievement of specific company goals.
According to their function, we can put KPIs into 4 broad categories: financial performance KPIs, internal process quality KPIs, customer satisfaction KPIs, and employee satisfaction KPIs.
Financial performance KPIs
Financial KPIs use metrics that are concerned with all forms of money-related activities inside an organization. So, they might measure revenue growth, profit margins, expenses, cash management, etc. Also, financial KPIs can be used to measure company performance in comparison to other businesses in the same industry.
Internal process performance KPIs
KPIs that estimate the quality of internal processes focus on operational performance inside the company. These KPIs measure, for example, the number of successful vs. unsuccessful products, or the time it takes to deliver a complete product or service.
Customer satisfaction KPIs
Customer satisfaction KPIs measure customer feedback. Therefore, they will focus on tracking the customer satisfaction score, rates of customer retention, or the efficiency of customer support teams.
Employee satisfaction KPIs
To measure employee satisfaction, we use KPIs that evaluate how employees experience the workplace. To do this, we observe the employee engagement index, employee satisfaction scores, rates of absenteeism, and other relevant metrics.
How to measure collaboration success with KPIs
We need objective measures to quantify and evaluate employee performance. One solution to this is to use Key Performance Indicators. When measuring collaborative success with KPIs, we need to keep in mind that the collaboration metrics we chose shape our understanding of what we measure.
In other words, if we choose metrics that do not affect our subject matter the way we expect them to, we will inevitably misinterpret the data. In the end, after all this effort to evaluate and measure collaboration, we will be left with useless sets of data.
To keep this from happening, we can use the SMART criteria to determine good choices of performance indicators. These indicators should be:
✅ S pecific — KPIs need to precisely target areas for improvement.
✅ M easurable — KPIs must be able to quantify and track progress.
✅ A ttainable — KPIs should be realistic and adjusted to circumstances.
✅ R elevant — KPIs should have a direct effect on goals.
✅ T ime-bound — KPIs need to have a limited duration of operation.
Next, we will put forward some of the specific KPIs you can use to measure team collaboration goals and skills, collaboration between teams, as well as the effectiveness of team collaboration tools.
How to measure collaboration goals
When a team is tasked with creating products or services, the best measure of team collaboration goals is the quality of these products. In order to produce a high-quality product, a team has to perform well, meaning that its members have to collaborate successfully.
The objective quality of products and services, within a free market, is measured by the financial gains they create, as well as customer feedback.
So, we can measure collaboration goals by using financial KPIs that track Net Profit, Revenue Growth Rate, and Average Revenue Per User. Additionally, we evaluate customer satisfaction by using the following KPIs: the Customer Satisfaction Score, the Rate of Client Retention, and the Net Promoter Score.
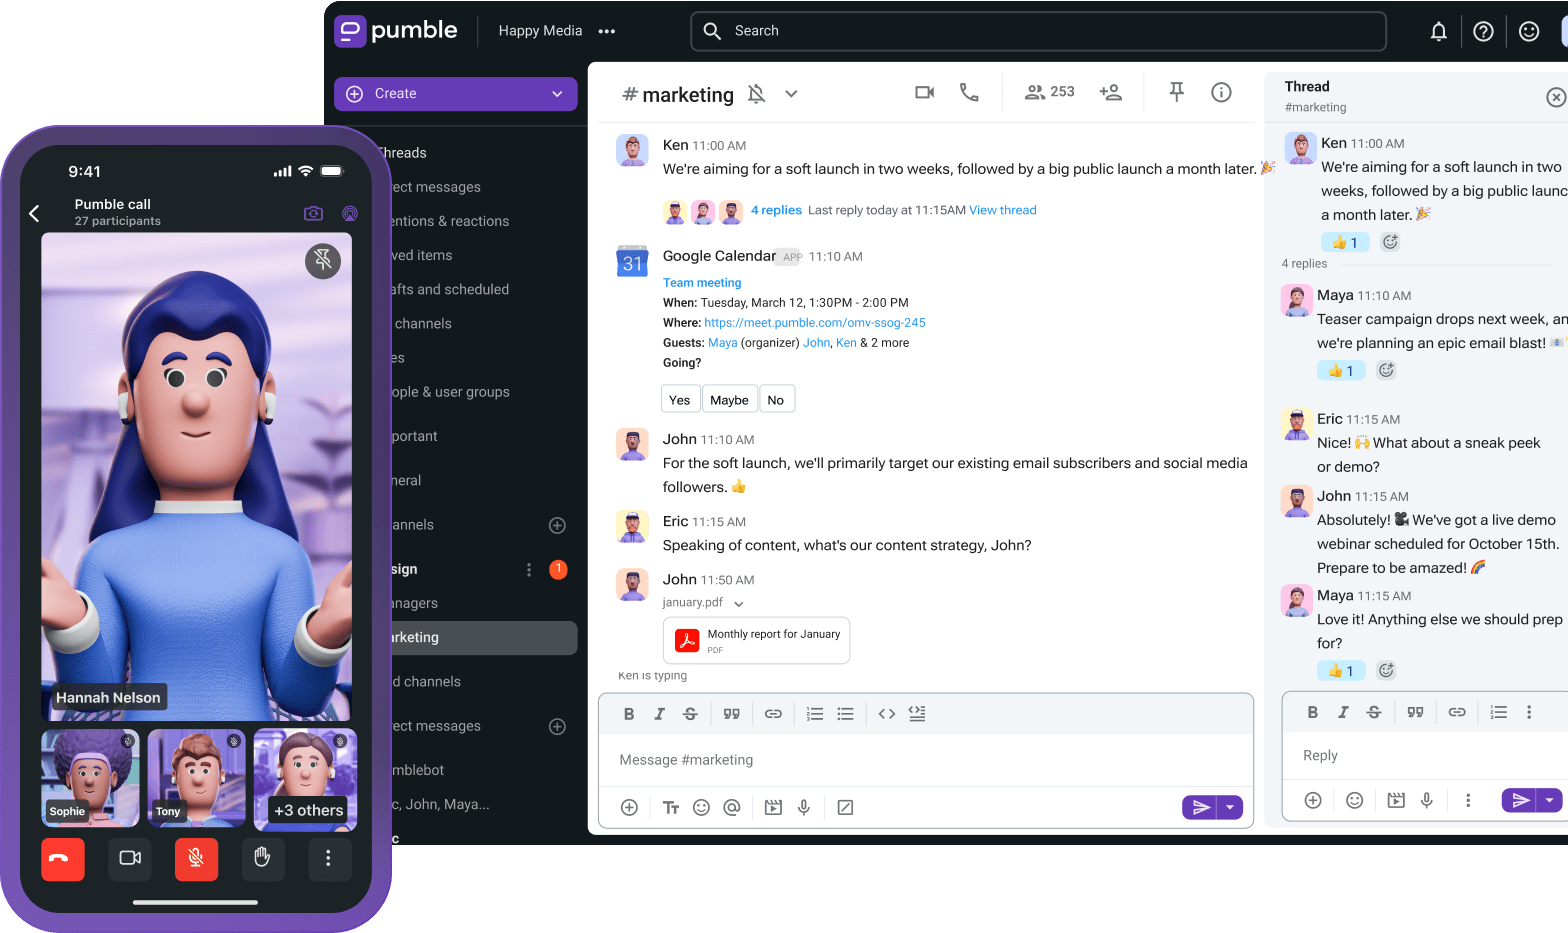
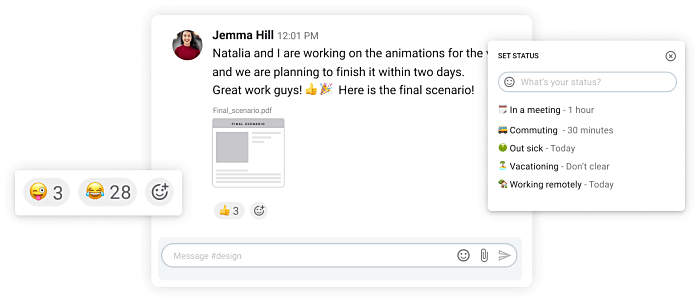
Align collaboration goals over Pumble
Net Profit
We can work out an organization’s Net Profit by subtracting the cost of production from the total revenue generated through sales. This KPI is usually considered the most important measure of business success. All companies strive for a net profit surplus, which puts them in a position where they can invest in growth.
Revenue Growth Rate
A company’s revenue is the amount of money it acquires over a certain period of time. It can be used to measure the rate of success in achieving set objectives. However, this number does not take into account the outflow of expenses.
The definition says that the rate of Revenue Growth is calculated by comparing the increase or decrease in sales a company makes in a certain time period. This rate is usually calculated annually, and is expressed in percentages.
Average Revenue Per User (ARPU)
According to the definition, Revenue per Client is calculated by dividing the total revenue by the number of clients, users, or subscribers. ARPU is used to measure the company’s revenue-generating capacity at the level of each customer. This KPI is useful when it comes to financial forecasting, comparison to similar companies, as well as finding out which tier of customers brings in the most profit.
Customer Satisfaction Index
The Customer Satisfaction Score presumes that customers who are satisfied with goods or services are more likely to buy again. Also, these customers develop brand loyalty and are more likely to leave positive feedback.
In terms of financial advantage, maintaining a good relationship with existing customers is far less costly than acquiring new ones.
The Customer Satisfaction Index is usually derived from surveys, which score criteria such as perceived value, expectations, and other criteria. These values are then combined into a single numerical score, used to determine the general level of satisfaction or dissatisfaction.
Client Retention Rate
Following along with the concept of customer brand loyalty, we can find the Client Retention Rate applicable. As it is considered a sign of good production quality, the customer retention rate measures the proportion of repeat buyers.
The Client Retention Ratio is usually calculated on a monthly basis. The formula used to calculate it looks like this:
CRR = ( E – N ) / S
Where the values represented are:
⏮ S — The number of customers at the start of a given period
🆕 N — The number of new customers
⏭ E — The number of customers at the end of a given period
To put this formula into words, we get the customer retention rate by first subtracting the number of new customers from the number of customers at the start of a period. Then, we divide the number we got by the number of customers we had at the beginning of the said period.
Net Promoter Score (NPS)
The Net Promoter Score measures customer experience, and can be used to predict business growth. The NPS uses a scale of 0 – 10 to assess customer satisfaction, by asking the question:
“How likely are you to recommend our goods and services to a friend or colleague?”
Based on the score customers give as an answer to this question, we can put them into three categories:
- Promoters ( score 9 – 10). Promoters are customers who are enthusiastic about sharing their satisfaction with the product or service. These are the people loyal to the brand, more likely to be repeat customers and to fuel growth by recommending the product or service to people in their surroundings.
- Passives ( score 7 – 8 ). In the category of passives, we have the customers moderately satisfied with the product, but not enthusiastic about recommending it to others. Passive customers are more likely to be open to offers from competitors.
- Detractors ( score 0 – 6 ). Detractors are customers dissatisfied with the products or services. These customers can impede growth and sully the brand image by sharing negative impressions.
We calculate the Net Promoter Score by subtracting the percentage of Detractors from the percentage of Promoters.

How to measure collaboration skills
We can define collaboration skills as those personal characteristics that allow you to successfully collaborate with other people. As these characteristics are unique to each individual, they are too abstract to measure directly.
Instead, we calculate the expression of collaborative skills in the form of team Project Schedule Variance, which points to how well people have combined their efforts to realize planned objectives. On the other hand, we have KPIs that measure how employees use their collaborative skills to shape the overall mood in the workplace. We do this by evaluating the rates of employee engagement and satisfaction.
Project Schedule Variance
The Project Schedule Variance is used to indicate whether the realized performance falls below, is equal to, or exceeds the planned performance. This KPI can be measured by choosing a point in time or comparing performance in different periods.
We calculate the Project Schedule Variance by subtracting the planned value from the actual, earned value. The most common unit of measurement is currency, and must be the same for both values (planned and earned).
Employee Engagement Index
Employee Engagement depends on the level of mental and emotional connection employees feel toward their team members and work surroundings. This KPI measures how employees perceive the workplace, and the feelings they have towards it.
Based on the level of personal engagement, we can put employees into four categories:
- Actively engaged employees ( 5 – 15 % ). These are the passionate, highly active employees. These people feel a deep sense of meaning and purpose in their work, which is reflected in their accomplishments. In fact, their passion is so abundant, it overflows and motivates people in their vicinity to improve their own performance. Highly engaged employees are positive, reliable, productive, and devoted to their work.
- Engaged employees ( 20 – 25 % ). Employees we would consider engaged maintain a steady level of commitment and a positive outlook towards their job. They are focused and work hard, providing a reliable foundation for the company.
- Somewhat disengaged employees ( ~ 50 % ). We could describe the way these people work as adequate. They fulfill the absolute minimum of their responsibilities, putting down a mental block as soon as the work hours are over. Generally, these people may sometimes experience brief periods of engagement, but on the whole, they find no deeper meaning in their work.
- Actively disengaged employees ( 5 – 15 % ). Workers who are actively disengaged feel deep-seated dissatisfaction with the job. Basically, they only show up for the paycheck. These are the people who gossip around, bad-mouth the company, and in a way try to be as unproductive as possible without getting fired. As a result, these employees disrupt the workflow, making the experience so much more unpleasant to those around them.
We use surveys to measure levels of employee engagement. These are created in a way that lets employees assess and self-report their impressions of the workspace. Namely, they pose questions that can be answered using a numerical scale. These answers combined make up the Employee Engagement Index.

Employee Satisfaction Index
The Employee Satisfaction Index measures the level of contentment employees feel in relation to their work roles. As happy people are 13% more productive, there is a clear link between levels of employee satisfaction and successful business performance.
This KPI is measured the same way as the Employee Engagement Index. So, a survey is issued for workers to report their level of satisfaction.
How to measure collaboration between teams
KPIs important to intra-team relations can also be used to measure the success of inter-team collaboration. This means that we can use the same KPIs we used to measure collaboration skills when it comes to measuring collaboration between teams.
Some additional collaboration metrics are introduced to emphasize the organizational aspects of inter-team collaboration. Therefore, we used the Manager Quality Index and the HR Effectiveness Index to gain a more precise estimate of the quality of collaboration between teams.
Manager Quality Index
The Manager Quality Index measures the overall employee satisfaction with the management team. As the perceived quality of managers directly influences employee satisfaction and engagement, it also greatly impacts levels of worker productivity.
This KPI is an aggregate of opinions about the manager’s personality, skills, and knowledge. We usually define it, again, through the use of self-assessment worker surveys.
HR Effectiveness Index
The HR Effectiveness Index is a measurement composed of a number of different financial and employee metrics. Some of these include reports on return on investment, labor turnover and productivity, employee satisfaction, etc.
Employee recruitment and training can determine rates of collaboration. This is because similar personalities tend to collaborate more easily, and HR has the task to pick out people who would fit their intended team. Also, whether the person has gone through training, and the quality of it, can make a difference in day-to-day communication. Due to receiving the appropriate training, employees have a larger set of communication techniques at their disposal.
How to measure the effectiveness of tools for collaboration
Keeping up with what other team members are doing makes people more productive.
For example, remote teams produce products and services more efficiently while using a tool that allows them to be aware of what others are doing. The increase in productivity is measured across all collaboration metrics, as it influences all levels and steps of production.
As an example, a team chat software can be an effective collaboration tool, as it allows quick and simple communication and information sharing.
Some KPIs we can use to measure the effectiveness of collaboration tools include the general usage of collaboration tools, as well as their top users.
General usage
Measuring metrics such as comments, likes, shares, etc. provides a general indication of the number of people using the tool, tracked over time. Having access to this type of data allows us to observe usage trends and the type of content employees are viewing and sharing. Also, we have insight into who are the people more likely to closely collaborate with each other, and to what extent.
Some technologies make it easy to see how people react to shared information. Also, being able to see a person’s online status makes it easier for remote teams to track hours of productive work.
Top users
Often, inside an organization, we find that there is a small number of employees that use collaboration tools considerably more than others. These are usually the actively engaged employees we described earlier. These are the passionate and enthusiastic workers, who are likely to influence others.
Seeing who the most proactive users are makes it easier to pinpoint and invest in people with more influence and growth potential.
Types of data KPIs measure & how to collect them
Key Performance Indicators can measure both subjective and objective data. By subjective, we mean the employee self-assessments, and by objective, we have in mind the data collected through external observation and tracking. There are different methods used to measure these two types of data.
How to collect subjective KPI data
Traditionally, surveys are used to make subjective data measurable. Therefore, the process of collecting subjective data starts when we ask people questions to determine their understanding and evaluation of the situation. Then, they are asked to answer by indicating a point on a scale, which is used to assign numerical values to various performance measurements.
For example, a common way of measuring the subjective level of situation understanding is asking survey participants to rate the extent to which they understand the situation. Another commonly used metric is the extent to which participants say they like or dislike collaboration strategies, changes made to them, or their impact on their day-to-day work.
There are two major issues with relying on survey-based data. First, surveys do not easily scale across large organizations. Additionally, due to high costs and the need for administrator approval, they usually only capture data within a single entity or across several smaller entities. Second, surveys are by definition biased. Participant opinions are distorted by personal preconceptions and limited to a certain sphere of activity.
4 Surveys we can use to measure subjective KPI data
Here we have a list of four surveys we can use to measure collaboration success in different contexts:
- The Collaboration Survey is used tomeasure perceptions of collaboration. The Collaboration Survey can provide organizations with insights as to where employees perceive things are going and which areas they believe additional attention is needed. This survey uses 21 different items relevant to collaboration effectiveness and operations.
- Levels of Collaboration Scale can measure the degree of collaboration within a partnership or a coalition. This survey was developed at the University of Kansas, and is primarily used to measure collaboration among grant partners. Participants can report the level of perceived collaboration, which is then aggregated into a mean level of collaboration across all respondents.
- PARTNER is a social network analysis tool designed to measure and track collaboration among people and organizations. It was designed with rural health networks and coalitions in mind. As such, it seeks to demonstrate how team members are connected, how resources are leveraged and exchanged, what are the levels of trust, and the links of outcomes to the process of collaboration.
- Collaborative Practice Scale (CPS) is designed to measure collaborative practices reported by nurses and physicians. This survey asks the participants to rate interactions between nurses and physicians according to the level to which they “enable the knowledge and skills of both professionals to synergistically influence the patient care being provided”.

How to collect objective KPI data
To contrast with self-reported subjective measures, we have objective performance measurements. These are the measurements we get by observing and keeping track of activities we consider important for our subject matter —in this case, collaboration success.
The intensity of electronic communication and meeting data exchange are important collaboration metrics of the nature and rates of collaboration among employees. Both of these types of data can reveal the types of collaboration involved in the interaction, as well as the work roles and personal traits of people who are more likely to collaborate.
But the most significant advantage of measuring objective KPI data is the ability to track productivity levels and their effect on financial performance.
Companies use various types of software to track their employees’ productivity, including time tracking apps, project management software, and team messaging systems.
Aside from direct monitoring of electronic and meeting data, there are less intrusive methods of collecting data. Some of these include:
- Writing down overheard conversations on the topic of collaboration
- Reviewing documents prepared on the subject of collaboration
- Observing behavior that indicates how people feel about collaborative practices
How to effectively use KPIs
When you have all of your KPI measurement results in front of you, what is the next step to take? A reliably effective line of action is to devise team collaboration strategies going forward.
When you’ve decided on your course of action, you can keep in mind some ways of effectively using KPIs.
The effectiveness of KPIs depends on how they are implemented. In fact, if you skip this step, all your other efforts might be in vain. There’s no point in setting KPIs if you don’t take the time to properly communicate them to your team members. Otherwise, you may end up in the situation of having perfect strategies failing completely due to miscommunication.
🎓 To find detailed information about typical communication missteps, check out our guide to the barriers of effective communication.
Some steps you can take to make effective use of KPIs possible include: setting clear objectives, sharing and updating information, and regular performance reviews.

Set clear objectives
Make an effort to develop fully fleshed-out objectives. This means that you should ask yourself a set of questions:
- What exactly do we want to achieve?
- Which methods do we want to use to achieve our objectives?
- How do these methods play out in the workplace?
- How will we track the progress of the methods we chose?
Based upon how you answer these questions, you can go on to develop an effective team collaboration strategy, one that will encompass all the important aspects of team collaboration success.
Share and update information
Once you set your objectives, make sure to properly communicate them to your team. So, you have to make sure that everyone is on the same page, to be able to fulfill KPI targets.
Also, as changes are made to your plans, ensure that you regularly update the rest of your team, so they have time and space to adjust.
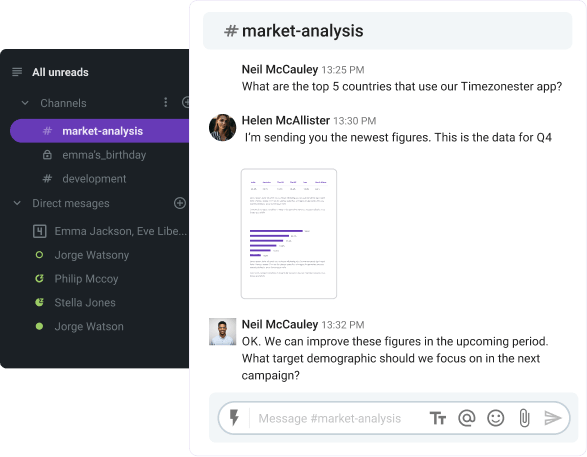
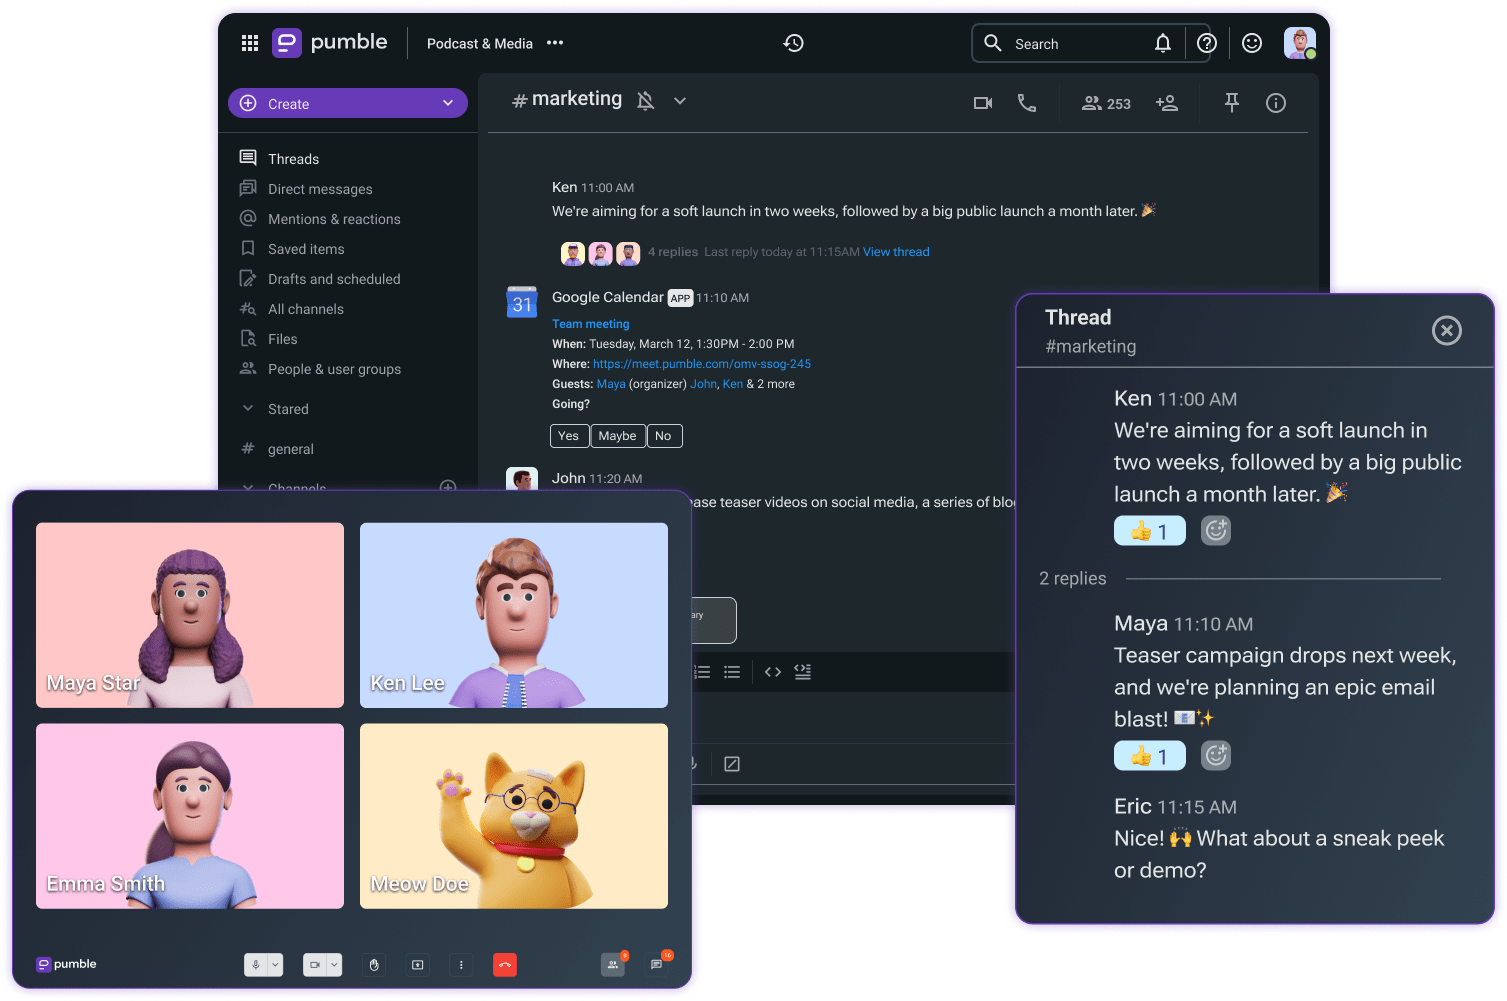
Share and ask for updates over Pumble
Schedule regular performance reviews
As the project moves towards the completion of its goals, you should hold regular performance reviews. These ensure that everyone stays informed about what the important metrics are and how you measure them.
Take the time to conduct surveys at the beginning of the project, and in regular intervals throughout the duration of the project. Ask employees what they think and feel about the changes you implement, and how they affect their everyday workload and productivity.
Improve collaboration metrics with Pumble by CAKE.com
Failing to evaluate the success of collaboration or using the wrong metrics to do so can lead to dysfunctional workplace practices.
To ensure that your team collaboration is top-notch, have your team use Pumble by CAKE.com!
Pumble is a team collaboration tool that allows organizations to seamlessly communicate and coordinate their organizational efforts.
The main objective of measuring collaboration is figuring out how people collaborate. With Pumble, you’ll have a clear overview of both the emotional effects of collaboration and all the ways individual employees contribute to it.
See how Pumble can change the way you track and measure collaboration — sign up for free today!
How we reviewed this post: Our writers & editors monitor the posts and update them when new information becomes available, to keep them fresh and relevant.