 Updated: May 30, 2025
 Did you know there are between 40 and 80 million digital nomads worldwide in 2025 — 44% of them from the US alone?
And, did you know that, on average, a digital nomad is 36 years old, earns around $124,170 per year and produces 74% less CO2 than the average American?
If the digital nomad lifestyle seems appealing to you and you want to learn more about future trends in digital nomadism, keep reading.
We bring you the most interesting figures about digital nomads for 2025, including the statistics on the:
- Digital nomad demographics,
- Best countries for digital nomads,
- Digital nomad lifestyle, and
- Future trends in digital nomadism.
Let’s get started!
- Between 40 and 80 million people in the world right now are digital nomads.
- 38% of digital nomads are Millennials.
- 78% of digital nomads identify as male.
- 44% of digital nomads are American.
- 90% of digital nomads report having a higher education.
- 56% of digital nomads hold traditional full-time positions.
- 70% of digital nomads work 40 hours or less per week.
- 59% of digital nomads work from a home office.
- 79% of digital nomads report being early adopters of technology.
- 79% of digital nomads report feeling very satisfied with their income.
What is a digital nomad?
The term was originally coined by Tsugio Makimoto and David Manners in their 1997 book titled Digital Nomad, which pretty accurately predicted the nomadic lifestyle we have been witnessing for the past couple of decades.
Furthermore, in their research report The Digital Nomad: Buzzword or research category, Müller defines digital nomads in the following way:
“The term ‘digital nomad’ describes people who no longer rely on work in a conventional office; instead, they can decide freely when and where to work. They can essentially work anywhere, as long as they have their laptop with them and access to a good internet connection. This means that their workplace might be in a shared office in Berlin, Germany for one month, and a month later they will be working on the same project in a café in Chiang Mai, Thailand.”
The definition and evolution of digital nomadism can’t be separated from the development of technology. The paper The History of Digital Nomadism helps us trace the evolution of the term, noting, for example, how the first telecommuting jobs gave rise to the first surge of backpackers in Thailand back in the 1980s.
It’s also important to note that the term digital nomad might be entirely replaced by the term “location-independent entrepreneur”, which communicates all the nuances that make up the lifestyle more accurately.
The difference between digital nomads, remote workers, and expats
The term digital nomad is often confused with two other similar terms — remote workers and expats.
To best illustrate the difference between digital nomads, remote workers, and expats, we can take a look at the scalar definition of the term digital nomad developed by Ina Reichenberger in the article Digital Nomads — a quest for holistic freedom in work and leisure:
“Digital nomads are individuals who achieve location independence by:
- Conducting their work in an online environment,
- Transferring this independence to mobility by not consistently working in one designated personal office space, but
- Using the possibility to simultaneously work and travel to the extent that no permanent residence exists.”
Therefore, as opposed to remote workers, which is a larger concept, the term digital nomad implies the element of travel.
Other papers, such as the 2025 study from the Marmara University in Istanbul, Türkiye also highlight factors that help separate digital nomads from other digital workers — tourism, leisure, and mobility.
And, in contrast with expats — digital nomads don’t strive for a permanent residence nor do they work for a company registered in the country they’re staying in.
Work while you’re on the go with Pumble
Statistics on the number of digital nomads worldwide
According to some sources, such as MBO Partners, there are around 40 million digital nomads in the world. However, other sources, such as the Nomads website — a worldwide community for digital nomads — claim there might be as many as 80 million.
Recent digital nomad survey — Digital Nomads: Toward a Future Research Agenda — reminds us of the limitations in accurate assessment of the actual number of digital nomads in the world, as:
- Digital nomads rarely inform their countries of origin about their plans to stay in other destinations (there are no legal requirements in most cases),
- Digital nomads rarely (need to) register in the countries they choose to stay in,
- There’s no clear proof as to whether digital nomads use any of the digital nomad visas available, and
- There’s even no consensus on the official definition of the term digital nomad.
That said, there are a few compelling surveys and studies that might help us get closer to answering how many digital nomads there are in the world.
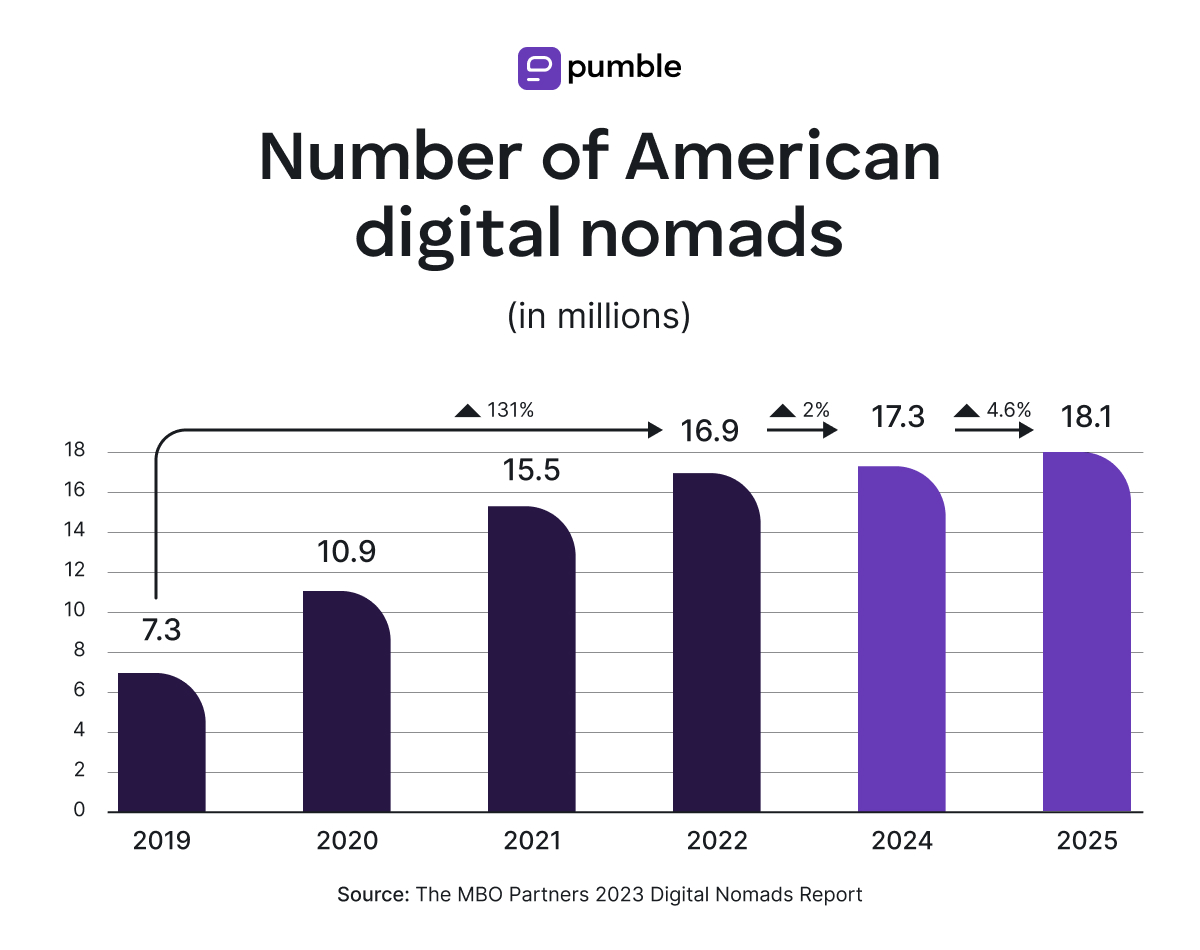
According to the 2024 MBO Partners’ research study, the number of digital nomads in the US is continually on the rise from 2019 onwards.
As expected, the pandemic had the biggest impact. The highest increase was noticed in 2020, which saw 10.9 million digital nomads, as opposed to 7.3 million in 2019 — a whopping 49% increase.
In 2021, the number of digital nomads worldwide increased 42% compared to 2020, with 15.5 million Americans identifying as digital nomads.
Although not as dramatically as in the first years of the pandemic, the numbers continued to grow steadily in 2022 when 16.9 million Americans said they identify as digital nomads. Data shows the total increase reached 131% from the pre-pandemic years (2019) to 2022.
Following the upward trend, 2023 saw a 2% increase in the number of American digital nomads compared to 2022 — which translates to around 17.3 million US citizens identifying as digital nomads.
In 2024, we saw a bigger increase compared to 2023 — 4.6%. In 2025, 18.1 million Americans stated they see themselves as digital nomads.
Statistics on the rising number of traditional workers becoming digital nomads
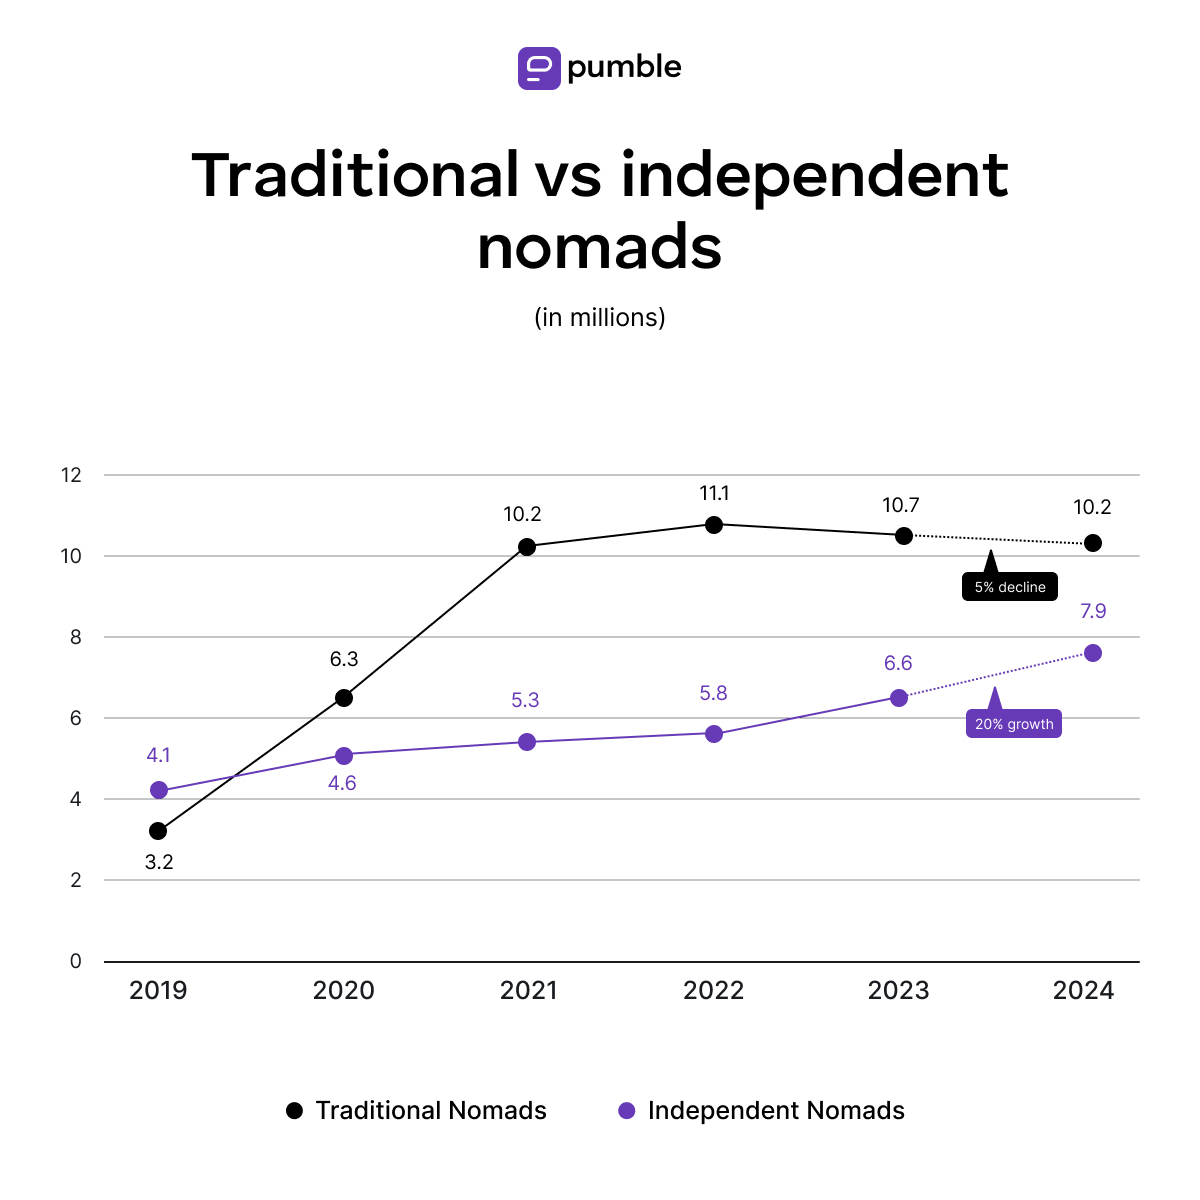
Compared to pre-pandemic times, the post-pandemic period saw an increase in traditional workers among digital nomads, as the latest MBO digital nomad data shows.
In 2022, 66% of digital nomads had traditional jobs (employed full time by a company), which is a 22% increase compared to 2019.
Another 2023 study by SafetyWing reveals similar data. When asked about the main reason for becoming digital nomads, 74.5% of digital nomads reported that the pandemic had the biggest impact on their decision to take the leap.
The trend saw a slight decline in 2023 and 2024 — 4% and 5% — mostly due to companies pushing for a more balanced hybrid approach.
According to Pumble’s Remote Work Statistics 2025, 75% of Americans working traditional jobs reported having to work from the office at least a couple of days per week. This, naturally, limits the digital nomads among them from fully committing to the nomadic lifestyle.
At the same time, and most likely for the same reason, the share of independent workers (independent contractors, freelancers, etc.) going nomad increased by 14% in 2023 and another 20% in 2024.
However, traditional workers still partake in nomading — even though their companies might require them to be in office a couple of times a week. According to the MBO digital nomad report, these “tethered nomads” still travel while working, but stay close to their offices so they can return when needed.
Statistics on the popularity of digital nomadism
Digital nomadism is still a popular lifestyle.
According to MBO insights, the digital nomad lifestyle has been becoming more and more popular among US citizens until 2023.
In 2024 and 2025, we see a slight decline in the average American’s desire to become a digital nomad.
Take a look at the table below to see a rough number of Americans interested in sampling the digital nomad lifestyle.
| Year | Number of Americans |
|---|---|
| 2019 | 54 million |
| 2020 | 65 million |
| 2022 | 72 million |
| 2023 | 70 million |
| 2024 and 2025 | 66 million |
However, it’s important to note that only 7–9% of those 66 million people will actually try out the nomadic lifestyle in 2025.
Statistics on the digital nomad demographics
In the early days of digital nomadism, we were able to paint a clear picture of what a typical digital nomad looks like. In most cases, this was a White man in his thirties freelancing in a creative (or creative-adjacent) field who is adventurous and loves the outdoors.
And, while most digital nomads still very much fall into at least some of these categories, we’re happy to see that the image typically associated with digital nomads is slowly starting to change into a more diverse one.
That being said, let’s analyze the profile of an average digital nomad in 2025 and get all the details.
We will start with the general profile and continue with a more specific analysis of each category.
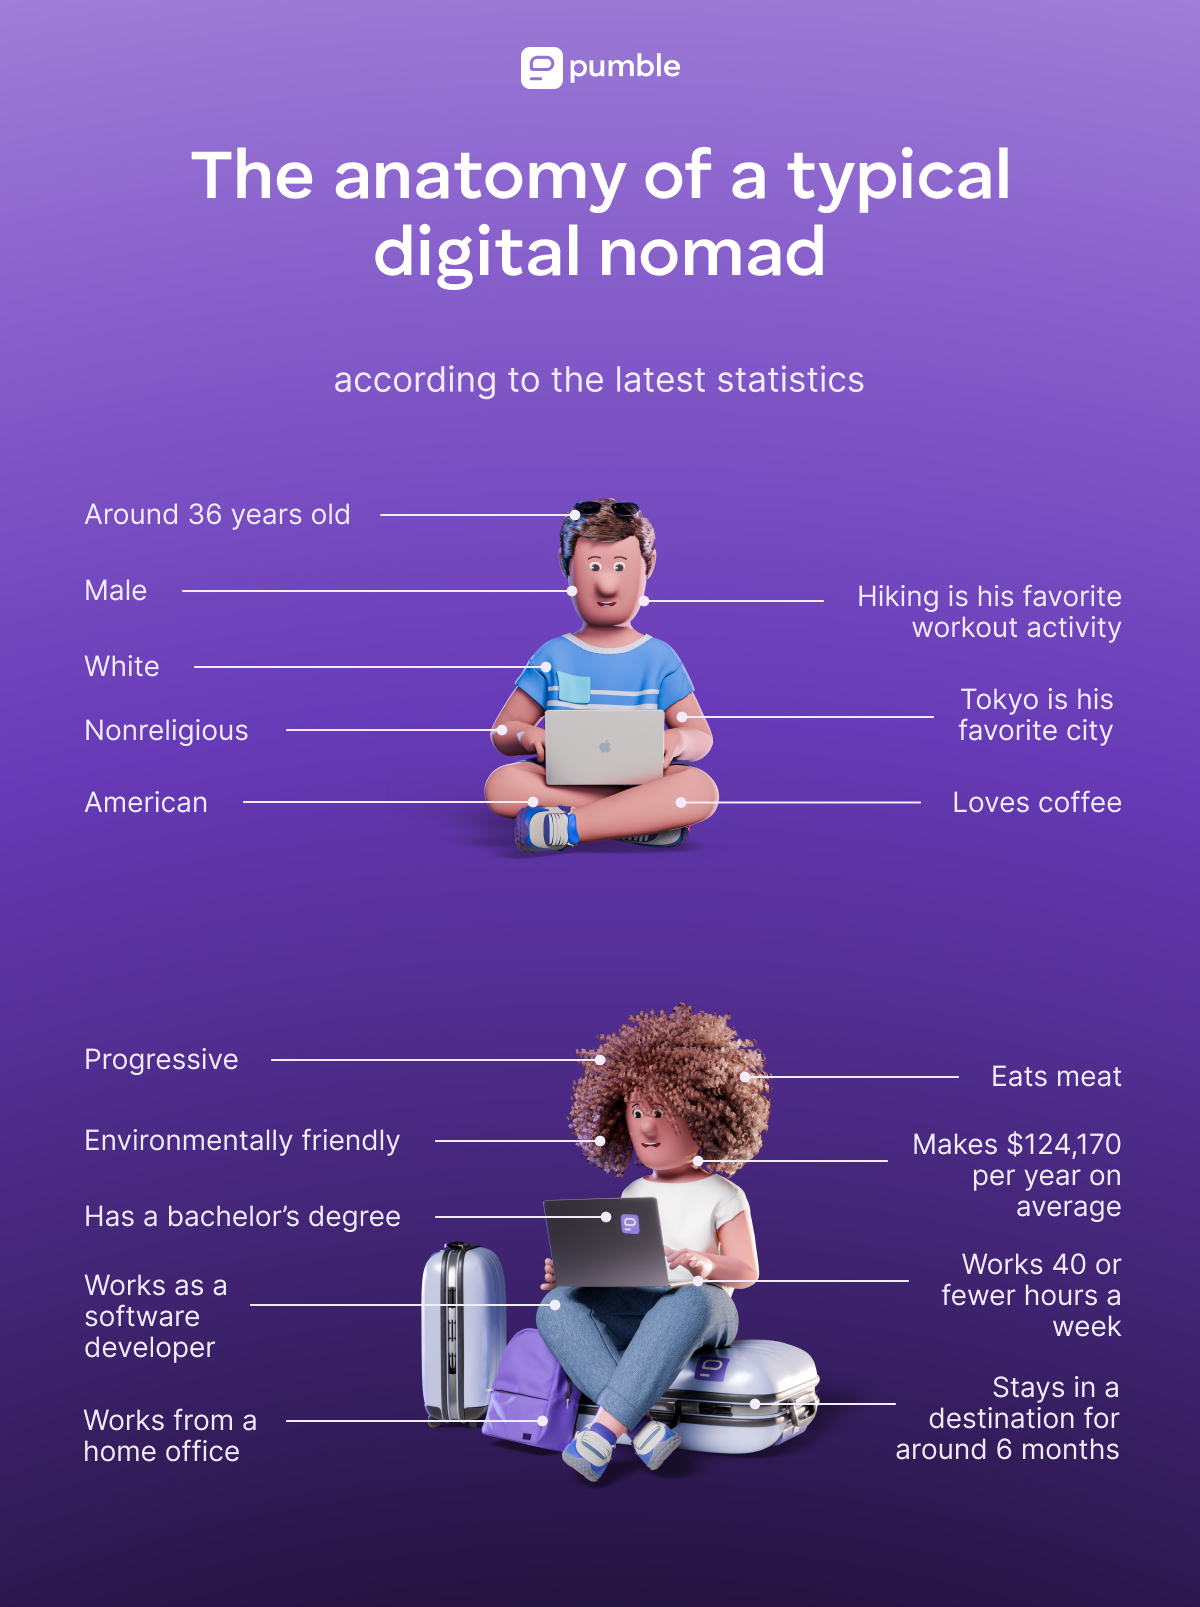
The anatomy of a typical digital nomad
According to the latest digital nomad statistics, this is the profile of a typical digital nomad in 2025:
- Around 36 years old,
- Male,
- White,
- Nonreligious,
- American,
- Progressive,
- Environmentally friendly,
- Has a bachelor’s degree,
- Works as a software developer,
- Works from a home office,
- Makes $124,170 per year on average,
- Works 40 or fewer hours a week,
- Loves coffee,
- Eats meat,
- Picks hiking as his favorite workout activity,
- Tokyo is his favorite city, and
- Stays at a destination for 6 months on average.
Digital nomads are predominantly young and male
According to data from the tens of thousands of Nomad List members presented in The 2025 State of Digital Nomads report, most digital nomads are young people aged between 25 and 44. The highest percentage of digital nomads is 36 years old (8%).
Although there’s some percentage of digital nomads in their early 20s and late 40s, the overwhelming majority of Nomad List members are in their 30s.
The nomadic lifestyle still appeals more to male nomads, with 78% of digital nomads identifying as male, as opposed to 22% of female digital nomads.
Similar data comes from MBO Partners, which consistently show a higher male-to-female ratio throughout the years. Namely, there were 56% of male and 44% of female nomads in 2023, and 59% of male and 41% of female nomads in 2024.
MBO Partners have analyzed the demographic of digital nomads by generation over the last 5 years and confirmed that the average digital nomad is a Millennial.
| 2020 | 2021 | 2022 | 2023 | 2024 | |
|---|---|---|---|---|---|
| Baby Boomers | 16% | 12% | 13% | 15% | 11% |
| Gen X | 23% | 23% | 23% | 27% | 25% |
| Millennials | 42% | 44% | 47% | 37% | 38% |
| Gen Z | 19% | 21% | 17% | 21% | 26% |
As you can see in the table above, in 2021 and 2022, we saw a shift in younger generations and a drop in the percentage of older generations — understandable due to the higher risk of COVID-19. In 2024 and 2025, Millennials still make up the highest percentage of digital nomads, however, we’re seeing more older and younger generations taking part.

Digital nomads skew American and White
Nomad List members are predominantly American. In 2025, US citizens make up 44% of digital nomads on the platform, which is precisely 44,996,021 people.
UK nationals take the second spot with only a 7% share — 7,189,556 people. Next up are Canada, Russia, Germany, France, Brazil, Australia, the Netherlands, and Spain, all of which make up 26% of digital nomads surveyed by the Nomad List platform.
The same research shows that:
- Most digital nomads are White (59%), while
- The other 41% are Non-White with:
- 14% Asian,
- 12% Latin,
- 7% Black,
- 5% Indian,
- 3% Middle Eastern, and
- 1% Pacific.
MBO Partners’ reports show a consistent breakdown of digital nomads based on their ethnicity and race:
- Almost ¾ of digital nomads identify as White (67%),
- 21% identify as African American,
- 11% are Hispanic,
- 6% are Asian, and
- 1% are from another background (respondents were allowed to give more than one answer to this question).
Digital nomads are progressive and non-religious
The overwhelming majority of nomad women — 72% — identify as progressive when it comes to their political preferences and affiliation, according to the Nomad List digital nomad statistics. Meanwhile, almost half nomad men share their beliefs — 46%.
Out of 54% of non-progressive nomad men:
- 27% consider themselves libertarian,
- 21% are centrist, while
- 7% lean conservative.
When it comes to the 28% of non-progressive nomad women,
- 13% are libertarian,
- 13% are centrist, and
- 2% identify as conservative.
The MBO Partners digital nomad report shows a similar political breakdown of digital nomads:
- 51% identify as democrats,
- 24% are republicans, while
- 23% declare themselves independents.
The majority of digital nomad respondents in a Nomad List research identify as non-religious (52%).
Out of the 48% of digital nomads identifying as religious:
- 28% resonate with spirituality,
- 9% are Christians,
- 3% identify as Buddhists,
- 2% believe in astrology,
- 2% are adherents of Islam,
- 2% identify with Judaism,
- 1% are Hindus, and
- A little below 1% are Sikhs.
Statistics on digital nomads’ education and professional life
On average, digital nomads are well-educated, tech-savvy individuals who make a good living working from a home office.
Let’s take a look at a detailed breakdown of digital nomads by education and professional life.
Digital nomads are well-educated
Digital nomad data from both Nomad List and MBO Partners digital nomad statistics shows that digital nomads are, by and large, well-educated.
Only 10% of the Nomad List respondents are high school graduates.
Conversely, 90% of digital nomads have a higher education, out of which:
- 54% of nomads have a Bachelor’s degree,
- 34% have a Master’s degree, and
- 3% have a Ph.D.
MBO Partners show similar stats:
- 52% of respondents report having a college degree or higher, and
- 18% say they have an advanced degree.
Digital nomads are independent workers
The Nomad List and MBO Partners have different findings regarding the type of employment most commonly present with digital nomad community members.
Namely, more than half of digital nomads (56%) hold traditional full-time positions in 2025, according to MBO Partners.
The Nomad List, however, shows slightly different data for employment type among digital nomads.
According to this source, in 2025:
- 38% of digital nomads are employed full time,
- 18% report being freelancers,
- 18% of digital nomads are startup founders,
- 9% are full-time contractors,
- 8% are agency contractors,
- 5% answered “other” when asked about their employment type,
- 2% chose part-time employment, and
- 1% said part-time contractors.
Pumble — best communication tool for remote workers
Digital nomads work around 40 hours a week from a home office
When it comes to their favorite work background, as in prior years, most digital nomads in 2025 prefer a home office.
Nomad List finds out:
- 59% of digital nomads work from a home office,
- 15% of nomads choose coworking spaces most often,
- 8% like to work from a cafe,
- 7% work from an office,
- 3% choose a dining table,
- 3% prefer the couch,
- 2% bed,
- 1% like to work from a balcony,
- 1% of digital nomads work from a van,
- A little below 1% work from the kitchen, and
- The rest reported working from a pool, a boat, a garden, or a library.
The fact that most digital nomads prefer to work from a home office may have something to do with the fact that the majority of them own a home. According to the research by the Nomad List, 54% of digital nomads are homeowners, while 46% of respondents report not owning a home.
That is a slight increase compared to 2024, when 53% of nomads were homeowners.
Digital nomads work less than the general workforce, however. A 2025 study that analyzed digital nomad Reddit threads showed that digital nomads have varying hours but that they usually work less than 40 hours per week.
Older studies, such as the survey by FlexJobs, reveal that most digital nomads (70%) spent 40 hours per week (or fewer) working. This means only one-third of digital nomads work more than 40 hours a week, compared to 86% of men and 67% of women non-digital nomads who work these hours.
Digital nomads are tech-savvy
Digital nomads statistics by MBO report that digital nomads have strong technical skills.
Namely, 79% of digital nomads rely on technology to be more competitive at their work, as opposed to 44% of non-digital nomads who do the same.
Moreover, 78% of digital nomads report their job depends on technology, which is true for only 56% of non-digital nomads.
Digital nomads also lead in the percentage of early adopters of technology — 79% are likely to be early adopters of technology (versus 43% of non-digital nomads). That makes sense, considering that 81% of them say their work depends on digital connections and technology.
Connect with your team — try Pumble
According to figures from previous years’ reports, digital nomads are also more skills-oriented than non-digital nomads:
- 73% of digital nomads (versus 53% of non-digital nomads) have participated in work-related skills training over the past years, and
- 68% of digital nomads, as opposed to 47% of non-digital nomads, report their work requires specialized training, education, or expertise.

Digital nomads make a good living
Digital nomads make a decent living overall.
Nomad List members earn an average income of $124,157 per year, with a median of $85,000 per year in 2025. The report shows a slight increase compared to last year’s numbers — at least when it comes to the average salary, which was $122,859 in 2024.
When it comes to the average earnings of digital nomads:
- 6% of the Nomad List members report earning less than $25k a year,
- 15% of them report earning between $25k–$50k a year,
- 34% earn between $50k and $100k annually,
- 35% of them make between $100k and $250k per year,
- 9% of the Nomad List members make between $250k and $1M annually, and
- 2% earn more than $1M per year.
According to MBO Partners’ study, almost half of the respondents (46% of them) said they earn $75,000 or more per year, while 17% of digital nomads report earning less than $25,000 a year.
Still:
- 79% of digital nomads report feeling very satisfied with their income, and
- 41% say they are moderately satisfied with their earnings (factoring in other benefits).
MBO Partners also find that digital nomads are overall more satisfied with their work, lifestyle, and income.
A whopping 79% of digital nomads report feeling highly satisfied with their work and lifestyle regardless of their income, versus 62% of non-digital nomads who feel satisfied with their work. This is a slight decrease compared to 2024, when 80% of digital nomads were highly satisfied.
Digital nomads work in a variety of tech professions and industries
Digital nomads come from a wide range of professions and industries — from sports and modeling to software development and finance.
Still, the overwhelming majority of digital nomads work in IT or IT-adjacent industries, according to the Nomad List digital nomad statistics and the data by MBO Partners.
MBO Partners show that in 2025, professionals in the following industries made up the digital nomad community:
- IT — 19%,
- Creative services — 14%,
- Education and training — 9%,
- Sales, marketing, and PR — 9%,
- Finance and accounting — 8%, and
- Consulting, coaching, and research — 7%.
This is consistent with the numbers from previous years.
The Nomad List members are career-wise predominantly:
- Software developers,
- Startup founders,
- Web developers,
- Marketing professionals,
- Creatives, and
- SaaS professionals.
Try Pumble — the best tool for software developers
There are slight differences in the chosen professions between male and female digital nomads, according to Nomad List members’ responses.
Nomad men mostly work in the following industries/positions in 2025:
- Software developers — 35%, which is 253% more than female nomad software developers,
- Web developers — 28%, which exceeds the female share by 262%,
- Startup founders — 28%, which is 137% more than nomad women in these professions, and
- SaaS professionals — 14%, which outnumbers the share of nomad women by 195%.
Nomad women mostly work in the following industries/positions in 2025:
- Marketing — 16% of nomad women, which exceeds the male share by 1%,
- Creative professions — 15%, which is 23% more than nomad men,
- Blogging — 8% of female digital nomads, which is 24% more than male nomad bloggers,
- Community professionals — 8%, which is 25% more than the male share in these professions, and
- Coaching professionals — 7%, which is 25% more than nomad men in these professions.
Male digital nomads are predominantly in IT, while nomad women mostly have a background in humanities
Interestingly, there are some pretty large differences between the professions mostly occupied by male digital nomads and professions predominantly held by digital nomad women.
The largest difference between genders when it comes to digital nomad professions is noted in the IT vs humanities comparison.
As you’ll see in the tables below, nomad men are far more likely to occupy positions in the IT sector. On the other hand, female digital nomads have a bigger share in positions in HR, Psychology, Medicine, and Journalism.
According to the Nomad List digital nomad statistics, these top 10 positions show the largest gender ratio difference in the digital nomad community in 2025.
| Positions most often occupied by nomad men | The share of male vs female nomads |
|---|---|
| Information security | +806% |
| Dev Ops | +353% |
| SysAdmin | +348% |
| Mobile developer | +347% |
| Game developer | +311% |
| Web developer | +262% |
| Software developer | +253% |
| Crypto | +243% |
| SaaS | +195% |
| VR developer | +172% |
Let’s get a closer look at the table below for a full picture of the 10 professions predominantly held by nomad women.
| Positions most often occupied by nomad women | The share of female vs male nomads |
|---|---|
| Human resources professional | +81% |
| Journalist | +49% |
| Psychologist | +45% |
| Medical professional | +41% |
| Support professional | +36% |
| Community professional | +25% |
| Blogger | +24% |
| Creative professional | +23% |
| Hospitality professionals | +23% |
Pumble — the best communication tool for HR professionals
Statistics on best countries for digital nomads
Digital nomads travel all around the world, according to the Nomad List findings, but have some preferred spots.
Just like in 2024, in 2025, the most visited countries by digital nomads are:
- The USA,
- Spain, and
- Thailand.
When it comes to the most visited cities, the largest portion of digital nomads visited:
- London,
- Bangkok, and
- New York City.
This is consistent with the numbers from previous years.
Here’s the list of the top 10 most visited countries by digital nomads so far in 2025:
| # | Country | % of digital nomads who visited the country |
|---|---|---|
| 1 | The US | 14% |
| 2 | Spain | 5% |
| 3 | Thailand | 5% |
| 4 | The UK | 4% |
| 5 | Germany | 4% |
| 6 | Mexico | 4% |
| 7 | France | 3% |
| 8 | Italy | 3% |
| 9 | Portugal | 3% |
| 10 | Indonesia | 2% |
Let’s take a closer look at the top 10 cities visited by digital nomads.
| # | City | % of digital nomads who visited the city |
|---|---|---|
| 1 | London (UK) | 2.23% |
| 2 | Bangkok (Thailand) | 2.15% |
| 3 | New York City (US) | 1.51% |
| 4 | Barcelona (Spain) | 1.50% |
| 5 | Paris (France) | 1.48% |
| 6 | Berlin (Germany) | 1.47% |
| 7 | Lisbon (Portugal) | 1.46% |
| 8 | Amsterdam (Netherlands) | 1.22% |
| 9 | San Francisco, CA (US) | 1.16% |
| 10 | Chiang Mai (Thailand) | 1.08% |
It’s important to note, however, that most visited destinations don’t always translate into most liked ones, as we can see from the following lists of most and least liked countries by digital nomads in 2025 so far, respectively.
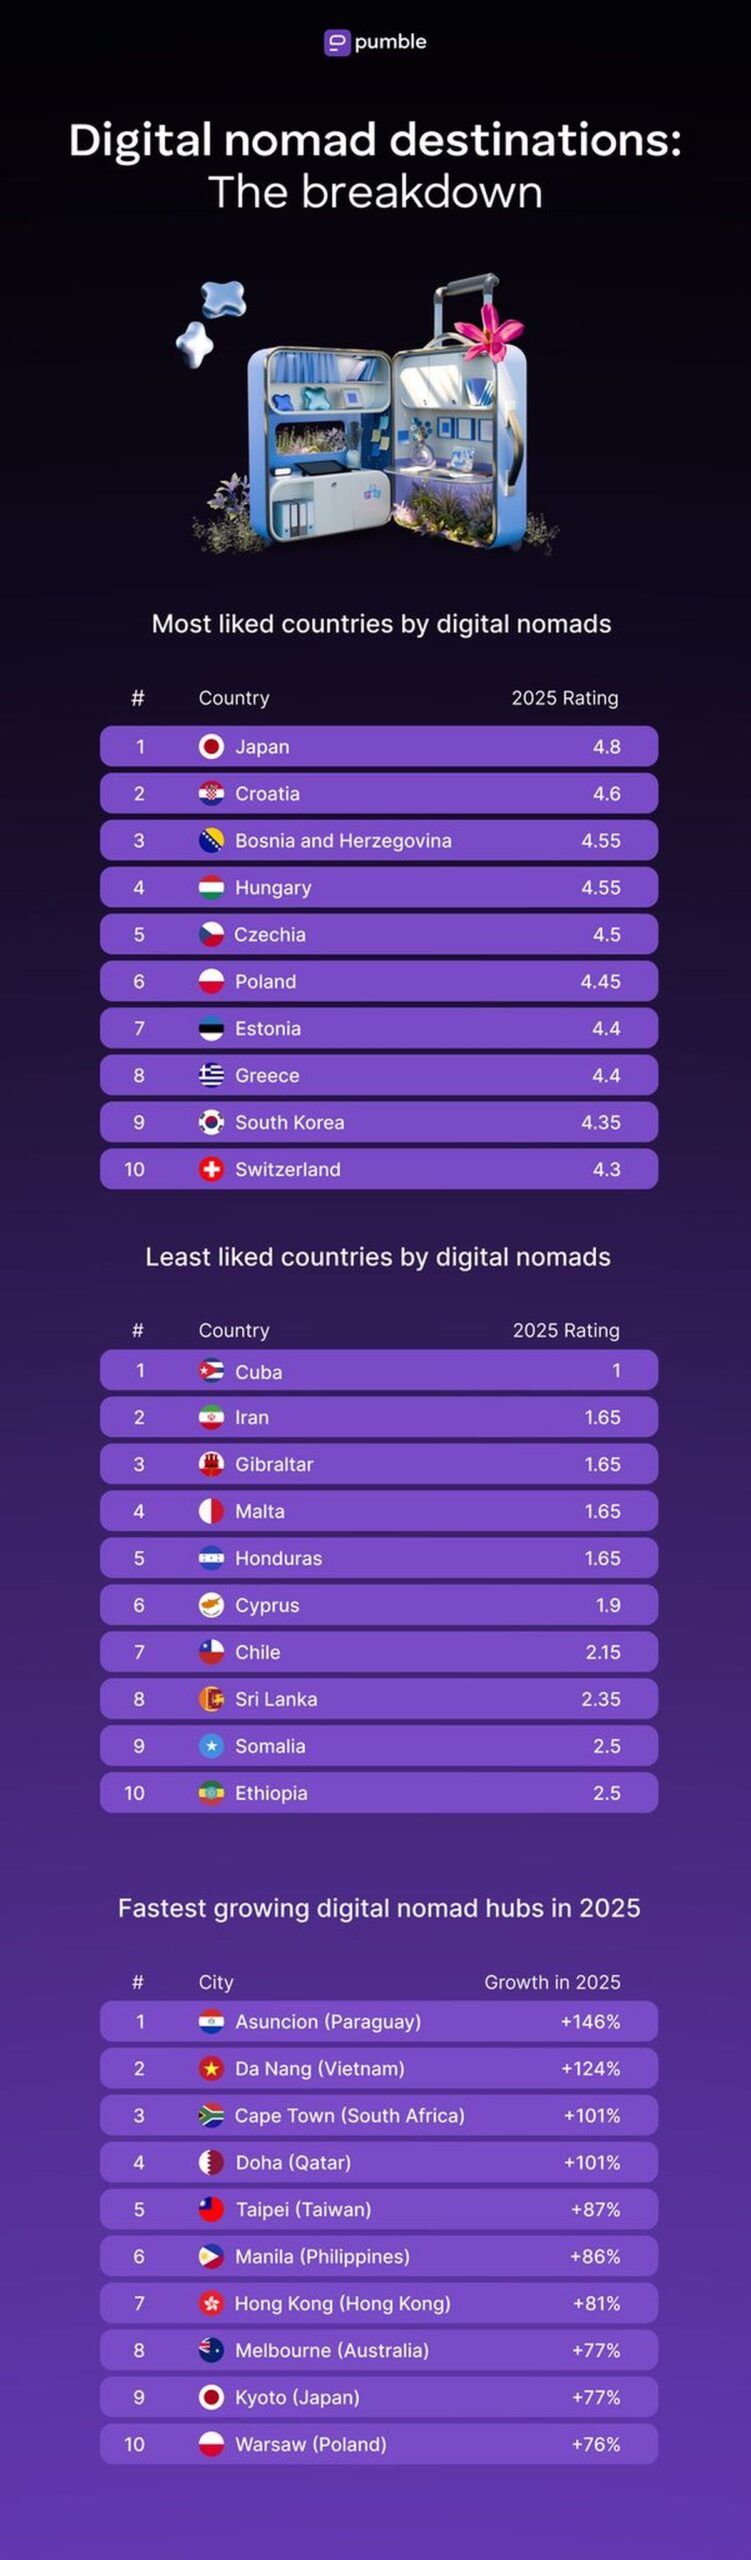
Take a look at the 10 countries that won the hearts of digital nomads in 2025 so far.
| # | Country | Rating |
|---|---|---|
| 1 | Japan | 4.8 |
| 2 | Croatia | 4.6 |
| 3 | Bosnia and Herzegovina | 4.55 |
| 4 | Hungary | 4.55 |
| 5 | Czechia | 4.5 |
| 6 | Poland | 4.45 |
| 7 | Estonia | 4.4 |
| 8 | Greece | 4.4 |
| 9 | South Korea | 4.35 |
| 10 | Switzerland | 4.3 |
Of course, not every destination is equally appealing to digital nomads as the 10 above. So, here’s an insight into which destinations were digital nomads’ least favorite.
| # | Country | Rating |
|---|---|---|
| 1 | Cuba | 1 |
| 2 | Iran | 1.65 |
| 3 | Gibraltar | 1.65 |
| 4 | Malta | 1.65 |
| 5 | Honduras | 1.65 |
| 6 | Cyprus | 1.9 |
| 7 | Chile | 2.15 |
| 8 | Sri Lanka | 2.35 |
| 9 | Somalia | 2.5 |
| 10 | Ethiopia | 2.5 |
Best and worst destinations for expats
When it comes to more long-term settling, expats and digital nomads who plan to extend their stay seem to have a different set of requirements.
As the Expat Insider 2024 report suggests, the ideal destinations for expats offer a relatively low cost of living and ease of settling in.
These are the precise reasons that catapulted Panama, Mexico, and Indonesia to the top of the list of best expat destinations.
Here are the top 10 destinations that dazzled expats in 2024 and continue to do so in 2025 — ranked by the Expat Insider respondents:
- Panama,
- Mexico,
- Indonesia,
- Spain,
- Colombia,
- Thailand,
- Brazil,
- Vietnam,
- Philippines, and
- UAE.
At the same time, Kuwait, Türkiye, and Finland are rated lowest in vital categories, as these countries offer low-quality social life, high cost of living, and low job satisfaction.
Here’s the list of the 10 worst-rated destinations (out of 53 in total) that expats will probably be avoiding in 2025:
44. UK,
45. Ireland,
46. Malta,
47. Italy,
48. Norway,
49. Canada,
50. Germany,
51. Finland,
52. Türkiye, and
53. Kuwait.
Favorite digital nomad destinations by gender
When it comes to most liked cities by digital nomads, nomad men and nomad women have different preferences.
The top 5 cities male digital nomads like the most in 2025 (according to respondents in the Nomad List research) are the following:
| # | City | Rating |
|---|---|---|
| 1 | Tokyo (Japan) | 4.55 |
| 2 | Mexico City (Mexico) | 4.55 |
| 3 | Singapore | 4.44 |
| 4 | Athens (Greece) | 4.44 |
| 5 | Madrid (Spain) | 4.44 |
Nomad women, on the other hand, had a completely different set of cities and destinations in mind for the highest rating.
Let’s take a look at the top 5 cities nomad women like the most:
| # | City | Rating |
|---|---|---|
| 1 | Medellín (Colombia) | 4.00 |
| 2 | Budapest (Hungary) | 3.75 |
| 3 | Los Angeles, CA (USA) | 3.75 |
| 4 | Mexico City (Mexico) | 3.00 |
| 5 | Vienna (Austria) | 3.00 |
Interestingly, the top destinations for male and female digital nomads look significantly different in 2025 compared to the previous two years.
For instance, Tokyo is the only destination found on the 2023, 2024, and 2025 lists for male digital nomads. However, it went from #1 in 2023 to a 13th spot in 2024, and then back to #1 in 2025.
Meanwhile, the 2025 list of most liked cities by female digital nomads also looks quite different from the ones from 2023 and 2024, barring the fact that Medellin ranks as #1 city on all 3 lists.
Here are the countries more men nomads go to in 2025:
| # | Country | Share of male vs female nomads that stay there |
|---|---|---|
| 1 | Russia | +84% |
| 2 | Poland | +71% |
| 3 | Romania | +57% |
| 4 | Georgia | +49% |
| 5 | Hong Kong | +27% |
| 6 | UAE | +27% |
| 7 | Serbia | +25% |
| 8 | Czechia | +24% |
| 9 | China | +24% |
| 10 | New Zealand | +22% |
And, these are countries that more women nomads go to in 2025:
| # | Country | Share of female vs male nomads that stay there |
|---|---|---|
| 1 | South Africa | +51% |
| 2 | Costa Rica | +50% |
| 3 | Mexico | +39% |
| 4 | United Kingdom | +29% |
| 5 | Chile | +21% |
| 6 | France | +20% |
| 7 | Croatia | +20% |
| 8 | Italy | +17% |
| 9 | Greece | +13% |
| 10 | Peru | +13% |

Fastest growing digital nomad spots
Nomad List brings a breakdown of the up-and-coming remote work hubs and digital nomad spots competing for remote workers’ attention in 2025.
Their study on the Fastest Growing Remote Work Hubs of 2025 shows the real-time rating of the most popular spots digital nomads and remote workers are flocking to, as well as the trends over the last 5 years.
Let’s see the analysis of the live digital nomad data from 383,285 check-ins made by tens of thousands of Nomad List members.
Here’s a list of the 10 fastest-growing digital nomad hubs so far in 2025:
| # | Digital nomad hub | 2025 growth |
|---|---|---|
| 1 | Asuncion (Paraguay) | +146% |
| 2 | Da Nang (Vietnam) | +124% |
| 3 | Cape Town (South Africa) | +101% |
| 4 | Doha (Qatar) | +101% |
| 5 | Taipei (Taiwan) | +87% |
| 6 | Manila (Phillipines) | +86% |
| 7 | Hong Kong (Hong Kong) | +81% |
| 8 | Melbourne (Australia) | +77% |
| 9 | Kyoto (Japan) | +77% |
| 10 | Warsaw (Poland) | +76% |
Furthermore, these are the remote work hubs that have been on the upward trajectory over the last 6 years — from 2019 to 2025 (except for 2020, when all growth and travel was paused due to COVID-19):
| # | Digital nomad hub | 5-year growth |
|---|---|---|
| 1 | Fukuoka (Japan) | +145% |
| 2 | Marbella (Spain) | +135% |
| 3 | Da Nang (Vietnam) | +130% |
| 4 | Asuncion (Paraguay) | +110% |
| 5 | Busan (South Korea) | +106% |
When it comes to the already established digital nomad destinations experiencing steady growth over the last 5 years, we can highlight the following cities:
- Mexico City (Mexico),
- Valencia (Spain),
- Warsaw (Poland),
- Medellín (Colombia), and
- Malaga (Spain).
Digital nomad destinations with the fastest internet speed
One of the features that can make or break a destination’s success among digital nomads is the internet speed.
Naturally, digital nomads flock to countries and cities that allow them an uninterrupted work experience, and a fast and reliable internet connection is the most surefire way to provide this.
Nomad List shows the list of internet speeds in countries and cities popular among their 7,062,928 members.
Here are the fastest internet speeds in popular digital nomad destinations around the world, according to the Nomad List data.
| # | Country | Internet speed | Tests done |
|---|---|---|---|
| 1 | South Korea | 57 Mbps | 1,206x |
| 2 | Hungary | 54 Mbps | 367x |
| 3 | Switzerland | 51 Mbps | 753x |
| 4 | Spain | 50 Mbps | 2,432x |
| 5 | Denmark | 49 Mbps | 311x |
| 6 | Canada | 47 Mbps | 2,546x |
| 7 | Norway | 44 Mbps | 309x |
| 8 | Portugal | 44 Mbps | 1,271x |
| 9 | Lithuania | 43 Mbps | 200x |
| 10 | Poland | 43 Mbps | 1,478x |
When it comes to data on the countries with the fastest Internet, we can notice that it’s more or less consistent with the data from the previous two years — with some surprises, of course.
For example, the US dropped from the top 10 list in 2024 and tumbled down even further to #16 in 2025. Meanwhile, South Korea first jumped to 3rd place in 2024 and finally took 1st place in 2025.
Yet, if we look at the larger picture, we can notice a general consistency over several categories.
For example, South Korea is high on the list of the most favorite countries for digital nomads, and it’s also one of the digital nomad destinations with the fastest internet speed in the world.
When it comes to the cities with the fastest internet speed, US cities as well as those in the Netherlands seem to be dominating, as you can see in the table below.
| # | City | Internet speed | Tests done |
|---|---|---|---|
| 1 | Toulouse (France) | 128 Mbps | 35x |
| 2 | Dallas, TX (USA) | 110 Mbps | 98x |
| 3 | Utrecht (the Netherlands) | 106 Mbps | 25x |
| 4 | Fort Lauderdale, FL (USA) | 105 Mbps | 27x |
| 5 | Kassel (Germany) | 101 Mbps | 42x |
| 6 | Rotterdam (the Netherlands) | 101 Mbps | 69x |
| 7 | Phoenix, AZ (USA) | 96 Mbps | 25x |
| 8 | Seattle, WA (USA) | 96 Mbps | 61x |
| 9 | Bucharest (Romania) | 95 Mbps | 72x |
| 10 | Toronto (Canada) | 89 Mbps | 266x |
Communicate and collaborate uninterrupted — with Pumble
Statistics on the digital nomad lifestyle
Let’s take a look at some common lifestyle traits and preferences shared by digital nomads.
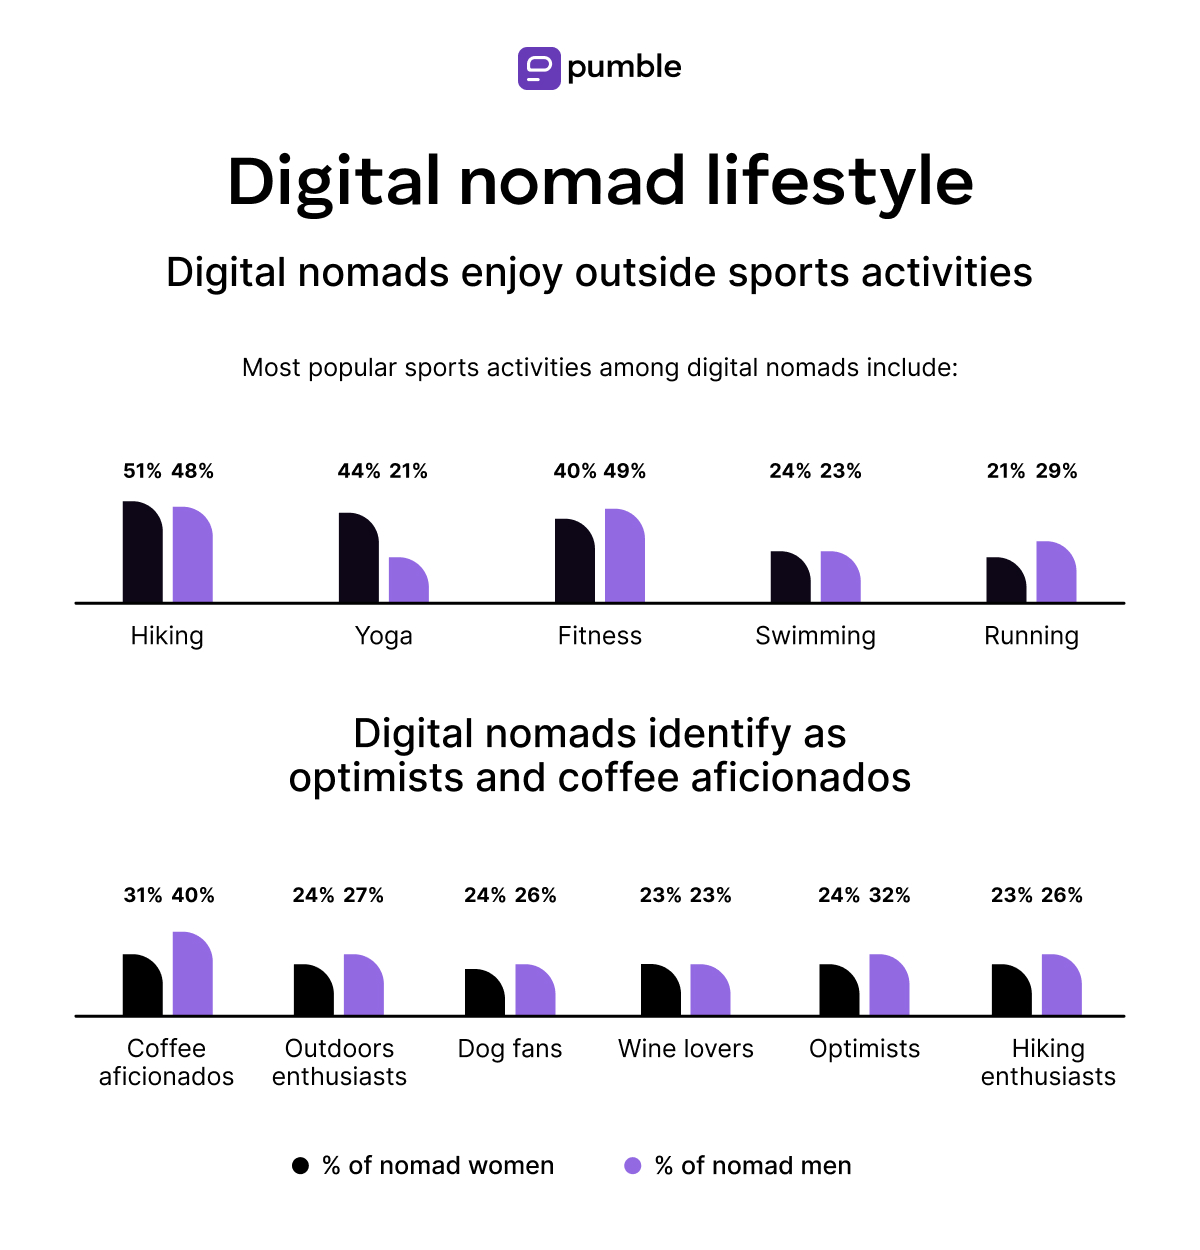
Digital nomads enjoy outside sports activities
The majority of digital nomads said hiking is their favorite workout activity. Almost half of male digital nomad respondents (48%) and 51% of nomad women reported that they hike.
Other popular activities among digital nomads in 2025 include:
- Fitness,
- Running,
- Yoga,
- Swimming, and
- Cycling.
Interestingly, according to the data from the Nomad List research, nomad men and women enjoy pretty much the same types of sports activities. The difference in shares between genders is almost negligible for most types of activities. Moreover, the data for 2025 looks almost the same as it did in 2023 and 2024.
Here’s a breakdown of sports activities of digital nomads by gender:
| Sport | % of nomad women | % of nomad men |
|---|---|---|
| Hiking | 51% | 48% |
| Yoga | 44% | 21% |
| Fitness | 40% | 49% |
| Swimming | 24% | 23% |
| Running | 21% | 29% |
| Cycling | 17% | 25% |
| Diving | 15% | 15% |
| Surfing | 15% | 18% |
| Climbing | 13% | 16% |
| Skiing | 12% | 15% |
Digital nomads eat meat
The Nomad List members identify as omnivores with a larger share of nomad men (76%) vs female digital nomads who eat meat (57%).
Moreover, out of 24% of men who don’t eat meat:
- 10% are vegan,
- 10% identify as vegetarian, and
- 4% say they are pescetarians.
At the same time, 43% of nomad women don’t eat meat, with:
- 18% of them being vegetarian,
- 15% vegan, while
- 10% of female digital nomad respondents identify as pescetarian.
Digital nomads like coffee and the outdoors
When asked to describe themselves by their likes and lifestyle interests, most respondents in the Nomad List study said they love coffee, dogs, hiking, and the outdoors.
As always, there are some differences in how female digital nomads described themselves versus what the male nomad respondents said about their likes and interests.
Let’s see these in more detail.
| Character traits | % of nomad women | % of nomad men |
|---|---|---|
| Coffee aficionados | 31% | 40% |
| Outdoors enthusiasts | 24% | 27% |
| English speakers | 26% | 32% |
| Dog fans | 24% | 26% |
| Optimists | 24% | 32% |
| Wine lovers | 23% | 23% |
| Hiking enthusiasts | 23% | 26% |
| Reading fans | 22% | 24% |
| Open-minded people | 20% | 24% |
Digital nomads are environmentally friendly
Similarly to the findings from 2023 and 2024, the Nomad List data shows that digital nomads produce less CO2 while traveling than the average American in 2025.
The research uses data from 383,135 trips by 14,957 members with emissions of CO2 of 115g per kilometer.
Namely, an average American generates around 5,000 kg of CO2 per year on commuting. By comparison, on average, digital nomads produce 1,293 kg of CO2 per year — a whopping 74% less than the average American.
This is especially interesting given that digital nomads are generally considered to travel more and larger distances than the average traditional workers. However, as the study suggests, digital nomads mostly work from their accommodations or coworking spaces, while the traditional workers still spend plenty of time (and CO2) commuting to and from work, which, seemingly, makes all the difference.
Digital nomads prefer slow travel
In recent years, most digital nomads prefer to slow down and immerse themselves in the local culture instead of rushing and moving around frequently.
More digital nomads are opting for a slower type of travel characterized by spending more time in each location and usually visiting fewer destinations — i.e., the “Slowmad travel”.
Almost half of the respondents interviewed by the MBO Partners in 2021, 2022, 2023, and 2024 said that they prefer slow travel, as it allows them to:
- Take in the local culture and communities more fully,
- Have better work productivity,
- Experience a richer and more active social life, and
- Reduce travel stress.
According to the Nomad List research, digital nomads change countries every 6 months on average, and they spend around 2 months in one city. This arrangement allows them to make the most out of their stays.
However, according to the MBO Partners report, digital nomads in the US plan less international travel in 2025, with:
- 51% of respondents reporting they will only travel in the US (compared to 53% in 2024),
- 49% of them saying they plan on some international travel (compared to 47% in 2024), and
- Only 7% of respondents planning to spend the entire year outside the US (compared to 10% in 2024).

Pros and cons of being a digital nomad in 2025
Digital nomadism has transformed the way we think about the modern workplace, travel, and our work-life balance, all at the same time.
Boost your work-life balance with Pumble
Still, it would be magical thinking to say that the digital nomad lifestyle is without its share of downsides.
So, to provide a complete picture of living a digital nomad lifestyle, let’s get a closer look at the statistics on the most common pros and cons of being a digital nomad.
Pros of being a digital nomad
According to MBO’s respondents, the most commonly reported benefits of the nomadic lifestyle (in order of importance — from most important to least important) include:
- The ability to travel when and where you want,
- Great work-life balance,
- Experiencing new cultures, and
- Meeting new people.
Moreover, a high percentage of digital nomads (81%) feel optimistic about the future of their careers. This number keeps increasing year after year — it was 78% in 2024.
Cons of being a digital nomad
Although super exciting and dynamic, nomadic life isn’t without its challenges.
Still, if we compare the MBO study findings for 2022, 2023, and 2024, we can see a declining trend in the most common challenges digital nomads are concerned with.
| Challenges | % of digital nomads experiencing the challenge in 2022 | % of digital nomads experiencing the challenge in 2023 | % of digital nomads experiencing the challenge in 2024 and 2025 |
| Personal safety | 34% | 26% | 24% |
| Being away from family and friends | 32% | 22% | 26% |
| Working across time zones | 30% | 21% | 23% |
| Loneliness | 26% | 21% | 17% |
| Travel logistics | 25% | 19% | 21% |
| Managing work and travel | 25% | 24% | 24% |
Stay connected across time zones — try Pumble
🎓 Pumble Pro Tip
If you think the pros of being a digital nomad outweigh the cons and you’re considering taking up the digital nomad lifestyle, check out our detailed guide about the subject:
What is the digital nomad trend in 2025?
The “Slowmad” and “VanLife” movements took the digital nomad community by storm in 2023 and 2024 and continue to be popular in 2025. Aside from that, in 2025, digital nomadism is becoming a family affair, which results in more resources being developed to support this type of lifestyle.
The VanLife Movement reached 3.1 million in 2022 (up from 2.6 million in 2021), which made it the fastest-growing digital nomad trend at the time.
This subgenre of digital nomads who traded the comfort of hotels and Airbnbs for the freedom of traveling, living, and working out of vans and RVs, originated before the pandemic. However, it took off during COVID-19, when global travel ground to a halt, mostly because it offered one of the few relatively safe options for entire families to travel together.
Similarly, 2024 and 2025 trends are showing a shift to nomadic lifestyles that include whole families.
This is one of the main indicators of digital nomadism becoming mainstream. As opposed to associating the term digital nomad with single, somewhat eccentric people in their 20s and 30s, we are now witnessing a shift in perspective. The typical digital nomad demographic is getting older and includes entire families with kids.
As MBO finds, in 2024:
- Median age of digital nomads was 37,
- 57% of them were married or living with a partner,
- 23% of American digital nomads traveled with their children, and
- 11% reported traveling with pets.
In addition to popularizing Slowmading, these arrangements gave rise to special education programs and family-friendly accommodations to better support digital families with children.
What is the future of digital nomadism?
The dramatic growth digital nomadism experienced in 2020 has brought mixed reviews and some opposing views on the trend.
However, 5 years later, in addition to seeing more families in the digital nomad community and slower travel, we’re witnessing a far more supportive environment.
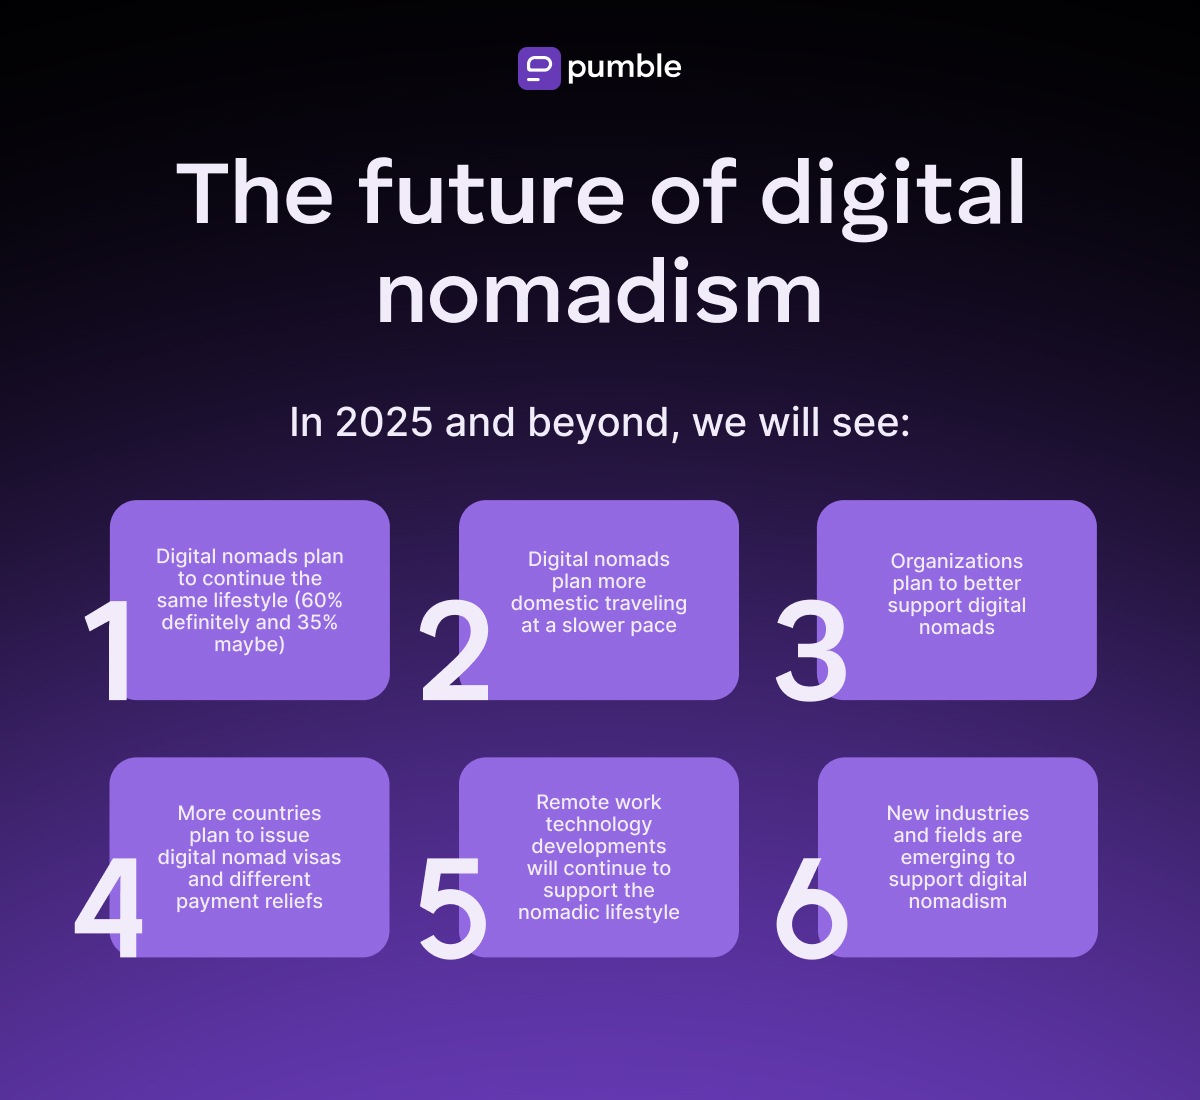
Digital nomads plan to continue on the same path
Almost all digital nomads (95%) plan to continue the same nomadic lifestyle for at least some time. Namely, 60% of them are definitely going to do it, while 35% responded with “maybe” when asked that question by the MBO Partners.
However, the same study reveals that between 15 and 17% of digital nomads return to a traditional lifestyle every year.
Still, when asked about the future, ex-nomads overwhelmingly state they would go back to their nomadic lifestyle — with 21% definitely planning for it and 58% saying they may do it.
Although these numbers show a slight decline compared to the previous year, this is mainly attributed to the return-to-office policies ordered by many companies.
More domestic “Slowmading”
As the MBO Partners report states, around 40% of American digital nomads plan to spend their 2025 traveling the US due to:
- Work restrictions,
- Geopolitical climate,
- Economic changes, and
- Personal reasons.
What’s more, they also plan on traveling across the US at a much slower pace. To allow more room for an active social life (and to reduce the stress that comes with working while traveling), American digital nomads plan to visit fewer locations in 2025.
This trend started in 2024, when digital nomads:
- Visited 6.6 locations — compared to 7.2 in 2023, and
- Spent an average of 5.7 weeks in each location — compared to 5.4 in 2023.
Stay connected while traveling — use Pumble
Organizations plan to better support digital nomads
After the initial skepticism towards the digital nomad lifestyle and how it would affect employee productivity and engagement, companies are now becoming more supportive of digital nomads.
Although we’re witnessing many companies enforcing strict return-to-office policies, overall, organizations are going remote-first and becoming digital nomad-friendly. To better suit the lifestyle and needs of the remote and nomadic workforce, companies are adopting new programs, models, and policies such as:
- The flexible working hours policy,
- Remote and hybrid work models, and
- The 4-day workweek policy.
Companies that have dabbled in the 4-week experiment have seen great benefits to both their bottom lines and employee satisfaction:
- Overall, employees noted a healthier work-life balance,
- 70% of employees reported feeling less burned out,
- Absenteeism decreased by 65%,
- Retention increased by 57%,
- 48% of employees reported feeling more satisfied with their jobs than when they first started,
- Revenue increased by 35% to 37% compared to the same period the year before, and
- 32% of people reported feeling less stressed.
All of these benefits also positively affect the life quality and work-life balance of digital nomads.
Organize your work better — with Pumble
More countries are issuing digital nomad visas and payment reliefs
As the digital nomad trend continues upward — although more slowly than before — more countries around the world are beginning to recognize the importance of digital nomadism for their economy and the overall positive international reputation.
This results in more countries working on creating or improving their digital nomad visa programs to accommodate a large number of digital nomads from all around the world.
There are now over 46 countries with digital nomad visas or similar programs aimed at digital nomads and remote workers.
In addition to creating these programs in the first place, governments are offering favorable tax and social security regimes for digital nomads. On top of that, there are other reliefs and benefits to create a more inclusive experience that accommodates the largest sample of the digital nomad community.
🎓 Pumble Pro Tip
If you want to explore digital nomad visa options in different countries globally, be sure to check out our digital nomad hub that offers complete guides on digital nomad visas for various countries:
Remote work technology development supports the nomadic lifestyle
Remote work technology experienced a sudden shift during the pandemic, and the upward trend continued over the past 5 years.
New and improved technology allowed digital nomads to do uninterrupted work anywhere in the world.
Faster internet speeds and better and more streamlined communication and collaboration software made it more convenient for digital nomads to effortlessly embrace the new lifestyle without falling behind on work.
According to Zippia’s research, 56% of regular workers use communication and collaboration tools daily. That number is much higher among remote workers and digital nomads, of course.
Moreover, Pumble’s Remote Work Statistics 2025 show a breakdown of the most commonly used remote tools by type:
- 80% of remote workers use instant messaging applications,
- 79% use collaboration tools,
- 74% use storage and document-sharing tools, and
- 47% of remote workers report using training and personal development tools.
Pumble — your all-in-one communication tool
New industries and fields sprung up to support digital nomads in 2025 and beyond
As the digital nomad movement grows in popularity, businesses are taking notice and starting to create more products and services designed with digital nomads in mind.
Portals to help digital nomads get informed, find work, and get legal advice have become common popular spots for digital nomad communities.
International health insurance and financial services aimed at helping digital nomads navigate these segments more easily are developing to better support digital nomads.
We can also expect to see more digital nomad communities and digital nomad villages offering entire work and living infrastructures in addition to opportunities to socialize with like-minded communities.
As we mentioned above, the Slowmad trend accompanied by more families becoming nomads are causing the development of special education programs and family-friendly accommodation facilities for long-term stays.
Finally, one of the industries that boomed with the digital nomad expansion is the coworking space market.
According to the Coworking Space Global Market Report 2025 by The Business Research Company, the global coworking space market size will reach $27.64 billion in 2025 — up from $23.25 billion in 2024, $19.05 billion in 2023, and $16.17 billion in 2022.
Communicate easily with Pumble
Keep your distributed team connected with Pumble by CAKE.com
Digital nomad statistics show an increase in the number of people embarking on a digital nomadic experience, on top of a growing number of digital nomads who plan to stay on the same path.
So, as your team members embark on their digital nomad journeys, your main challenge might be keeping everyone in the loop all the time.
Whether your team works exclusively in the office or you prefer to join your first meeting of the day from a beautiful beach setting somewhere warm and sunny — you don’t have to compromise on the quality of your team communication and connection with Pumble.
Pick the right communication tool — try Pumble
Pumble is a team communication app that keeps your team connected and synchronized through functionalities such as:
- Direct messages — for one-on-one chats,
- Channels — for team topic-oriented discussions,
- Video conferencing — for virtual meetings,
- File sharing — for productive collaboration, and
- Meeting recording — for asynchronous communication when your team members are working across time zones.
Experience more productive team communication and collaboration — try Pumble by CAKE.com today!
How we reviewed this post: Our writers & editors monitor the posts and update them when new information becomes available, to keep them fresh and relevant.