
Visual communication is sharing information, thoughts, and ideas with the use of visual elements such as images, graphics, illustrations, videos, etc. We rely heavily on visual communication in our daily and professional lives. Logos, posts on social media, presentation decks, etc. — all of that falls under the visual communication umbrella and gives meaning or adds context to our words.
Let’s dive deeper into the details of visual communication and its importance in our professional lives.
- Visual communication is a type of communication that is based on using visual elements to convey messages or information.
- The most important elements of visual communication are: colors, shapes, layout and space, and font.
- Visual communication is important because it brings clarity and understanding by adding context, increases the impact of the message, and makes the message more memorable.
- To make it as effective as possible, define the goal and audience of your visual communication, pick the right means and channel, make the visuals effective, and be consistent.
What is visual communication?
Visual communication is a type of communication that is based on using visual elements to convey messages or information. It consists of:
- Communication design — creating direct messages that get to the heart of the matter you want to communicate
- Graphic design — being as creative as possible to make the chosen message appear clear and attractive
Visual communication use various means to convey the message clearly and efficiently:
- Pictures
- Videos
- Social media posts
- Charts and diagrams
- Infographics
- Screenshots
- Illustrations
The 4 basic elements of visual communication
The most important elements of visual communication are:
- Colors — Can change moods, evoke feelings, or even persuade us to believe in something. Warm colors like red, orange and yellow symbolize energy, passion, and enthusiasm. But also, red can mean danger, so that’s why it is used for stop and warning signs. Green, blue and purple are the so-called “cool colors”. They are colors of professionalism and tranquility — that’s why many companies pick them for their logos (similarly to Pumble, a team communication app by CAKE.com).
- Shapes — Often the very heart of logos. They can be combined with colors, words, and other shapes, or used alone as an effective way of visual communication. However, most shapes are combined with letters and numbers in order to be more effective.
- Layout and space — The layout is the hierarchy of shapes, colors, and text in a visual. It’s especially important in creating manuals, advertisements, and workplace materials. Similarly, the use of positive and negative space makes all the difference between dull and engaging visuals. However, too much used space can come off too flashy or aggressive, while leaving a lot of unused space can make a visual mundane and not too effective.
- Type of font — The font needs to align with the idea or message behind the visual. Formal fonts are a better fit for official visuals while informal ones (like the infamous Comic Sans) are better used in casual situations. When it comes to company logos, pictures, and other brand visuals, it’s vital you pick the right type of font that will be the personification of the values you want to promote.

Why is visual communication important?
In terms of business communication, visual communication is important because it:
- Brings clarity and understanding — Adding contextual, high-quality images to your text ensures the audience understands it better. Images can turn confusing and complex topics into clear, understandable information. Plus, images can communicate your message even to people who don’t speak your language.
- Increases the impact of the message — It only takes 13 milliseconds to perceive a visual, while a 5-word slogan takes around 1 to 1.5 seconds. So, using images, graphs, or videos increases the chances of your message being seen. Not to mention, you can say more with one image than you could with 5 words.
- Makes your message more memorable — People tend to remember visuals more than text and visuals are more likely to get people’s attention.
How to use visual communication
There’s a myriad of ways you can use visual communication in your personal and professional life. Here are top 4 tips on how to do that to achieve the biggest impact:
- Define your goal and audience.
- Pick the right means and channel of communication.
- Make sure your visuals are effective.
- Be consistent and persistent.
Let’s take a detailed look at each of these.
#1: Define your goal and audience
Before doing anything else, you need to answer the following questions:
- Who are you sending your message to?
- What do you want them to understand or do?
So, essentially, you need to define who you’re talking to and what you want to tell them. And, who you’re talking to will determine how you speak to them (even in terms of visual communication).
For example, you wouldn’t create a presentation for your accounting team and a deck for your clients in the same way, right? Client communication requires more finesse, so you’d adapt your visuals to that.

#2: Pick the right means and channel of communication
Once you’ve defined your audience and your goal, you’ll need to come up with the best way to convey your message.
Think about visual hierarchy — which elements you want the audience to notice first, second, and third. You also have to consider formatting. How many sections you include, which ones hold the most important information, what the spacing is, etc. all determine how your audience will view the visual you present to them.
For example, if you’re creating a client presentation, you might want to build it around a single focal point and avoid overwhelming the page with visuals. That way, you’ll guide their attention in a way that works for you.
Aside from that, you’ll also want to think about the channel of communication that you’ll use to deliver the message. For example, you won’t spend time on a client presentation only to send it to them via email, right?
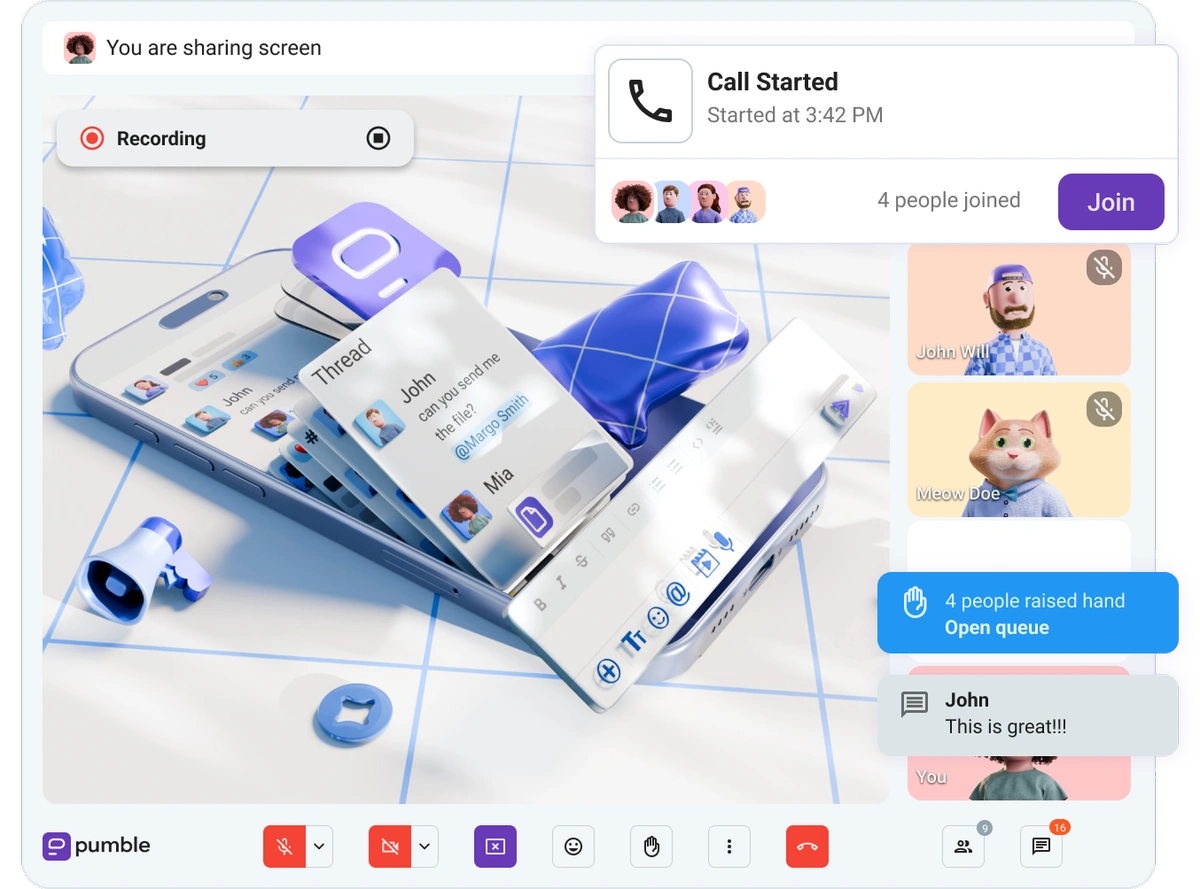
Instead, pick a channel that will allow you to present your message properly. For example, if you’re using a business messaging app like Pumble, you could use the video conferencing functionalities of the app like screen sharing to present your visuals to your clients in the most effective way.
#3: Make sure your visuals are effective
If you want your visuals to be effective, you have to pick the right ones for the job. This goes beyond choosing the right formatting and a proper layout that we’ve already talked about.
For example, depending on the information you’re presenting, you’ll want to use different visuals:
- Trends — use line graphs to show data progression.
- Comparisons — use bar charts to highlight contrasts.
- Processes — use structured flowcharts, diagrams, or timelines.
- Concepts — use symbols and visual metaphors instead of text.
Also make sure you’re using the right colors. Using 2 to 4 colors — ideally one neutral and one accent color — will highlight the data you’re presenting. However, don’t rely on color alone to transfer meaning. For example, don’t assume that, just because you’re using red, you’ll convey danger to the audience. Instead, pair the color with text, shapes, or anything else that will provide more context.
#4: Be consistent and persistent
It is crucial that you’re consistent with the visual identity of your brand. Stick to the (small) color palette you chose, and be consistent when it comes to fonts, layouts, and use of space across all your materials.
Being consistent and persistently presenting the same visual information makes the brand memorable. It increases the chance of recognition and creates trust.

Examples of visual communication in the workplace
We can see examples of visual communication everywhere around us: company logos, images and videos, social media posts, traffic signs, etc.
But, visual communication is also prevalent in our professional lives — we spend a lot of our time in video meetings and exchanging verbal and visual information via team chat apps.
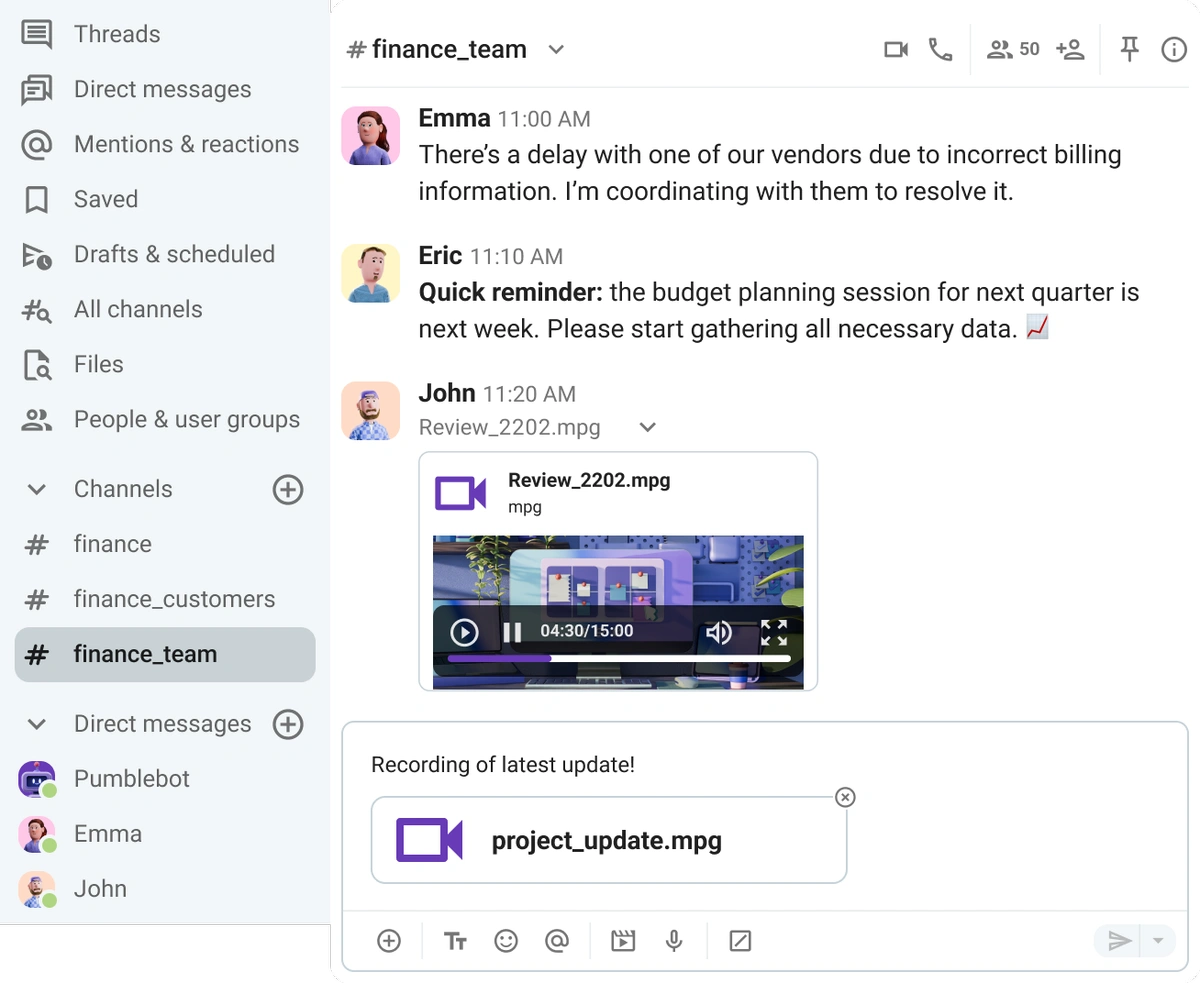
From informal chats to discussing structural changes and crises, everything happens online. That’s why it’s important to employ visual communication, as visuals such as graphs, diagrams, or infographics make it easier for employees to understand:
- Results
- New data
- New processes
- Scope of crisis
- Restructuring plans
Using visuals allows us to quickly share information and ideas. Let’s take a look at some common examples of visual communication in the workplace.
💡 Pumble Pro Tip
Visuals bring clarity which lowers the risk of communication breakdown. To learn more about communication breakdown and how it happens, check out the following article:
#1: Simplifying complex data and metrics
As mentioned, it’s difficult to present complex data with words alone. Better said, it’s difficult to maintain your audience’s attention and have them understand you if you’re not using visual aids.
If you have to present complex data or metrics to an audience, it’s best to use:
- Pie charts and bar graphs — Graphs are a simple and clean way to show parts of a whole and highlight big differences in data. Often used to show budget breakdowns, sales profits, market shares, survey results, etc.
- Infographics — Combine images, charts, and text into one visual, allowing for fast processing of a lot of data. Commonly used to explain processes, break down complex data, show timelines, etc.
- Dashboards — Similarly to infographics, dashboards allow for fast processing of a lot of information. Viewers can visualize data and see highlighted data trends on a dashboard. Often used to showcase KPIs, trends, performance outcomes, and other important numbers.
#2: Explaining processes and operation flows
When explaining processes and operation flows — most often during employee onboarding or training — it’s vital our audience understands us, as future performance depends on it. In those cases, use:
- Checklists — Turn abstract, confusing, multi-step tasks into an easy-to-follow sequence of tasks or steps. Used across industries to track progress, organize tasks, and avoid mistakes.
- Flowcharts and diagrams — Transform complex data into simple, sequential maps. Replace long paragraphs with symbols, shapes, and directional arrows to provide immediate clarity and make the data easy to follow. Often used to define, improve, analyze, or showcase processes.
- Project timelines — Map abstract deadlines into an easy-to-follow, chronological path. This allows the viewers to see how long each task or project sequence takes, when it will be finished, and what it depends on. Used to track progress, manage tasks and deadlines, pitch projects, etc.
- Instructional videos — Combine auditory and visual stimuli, which helps the audience process information faster, understand it better, and recall it easier.
Videos are perhaps the most important visual aid you can use when explaining processes and flows to others. If you use an app like Pumble, you can even make a whole knowledge database of instructional videos that you will store in your Pumble workspace. That way, it will serve as your digital headquarters, making it easy for new and existing employees to access instructional videos and other important information.
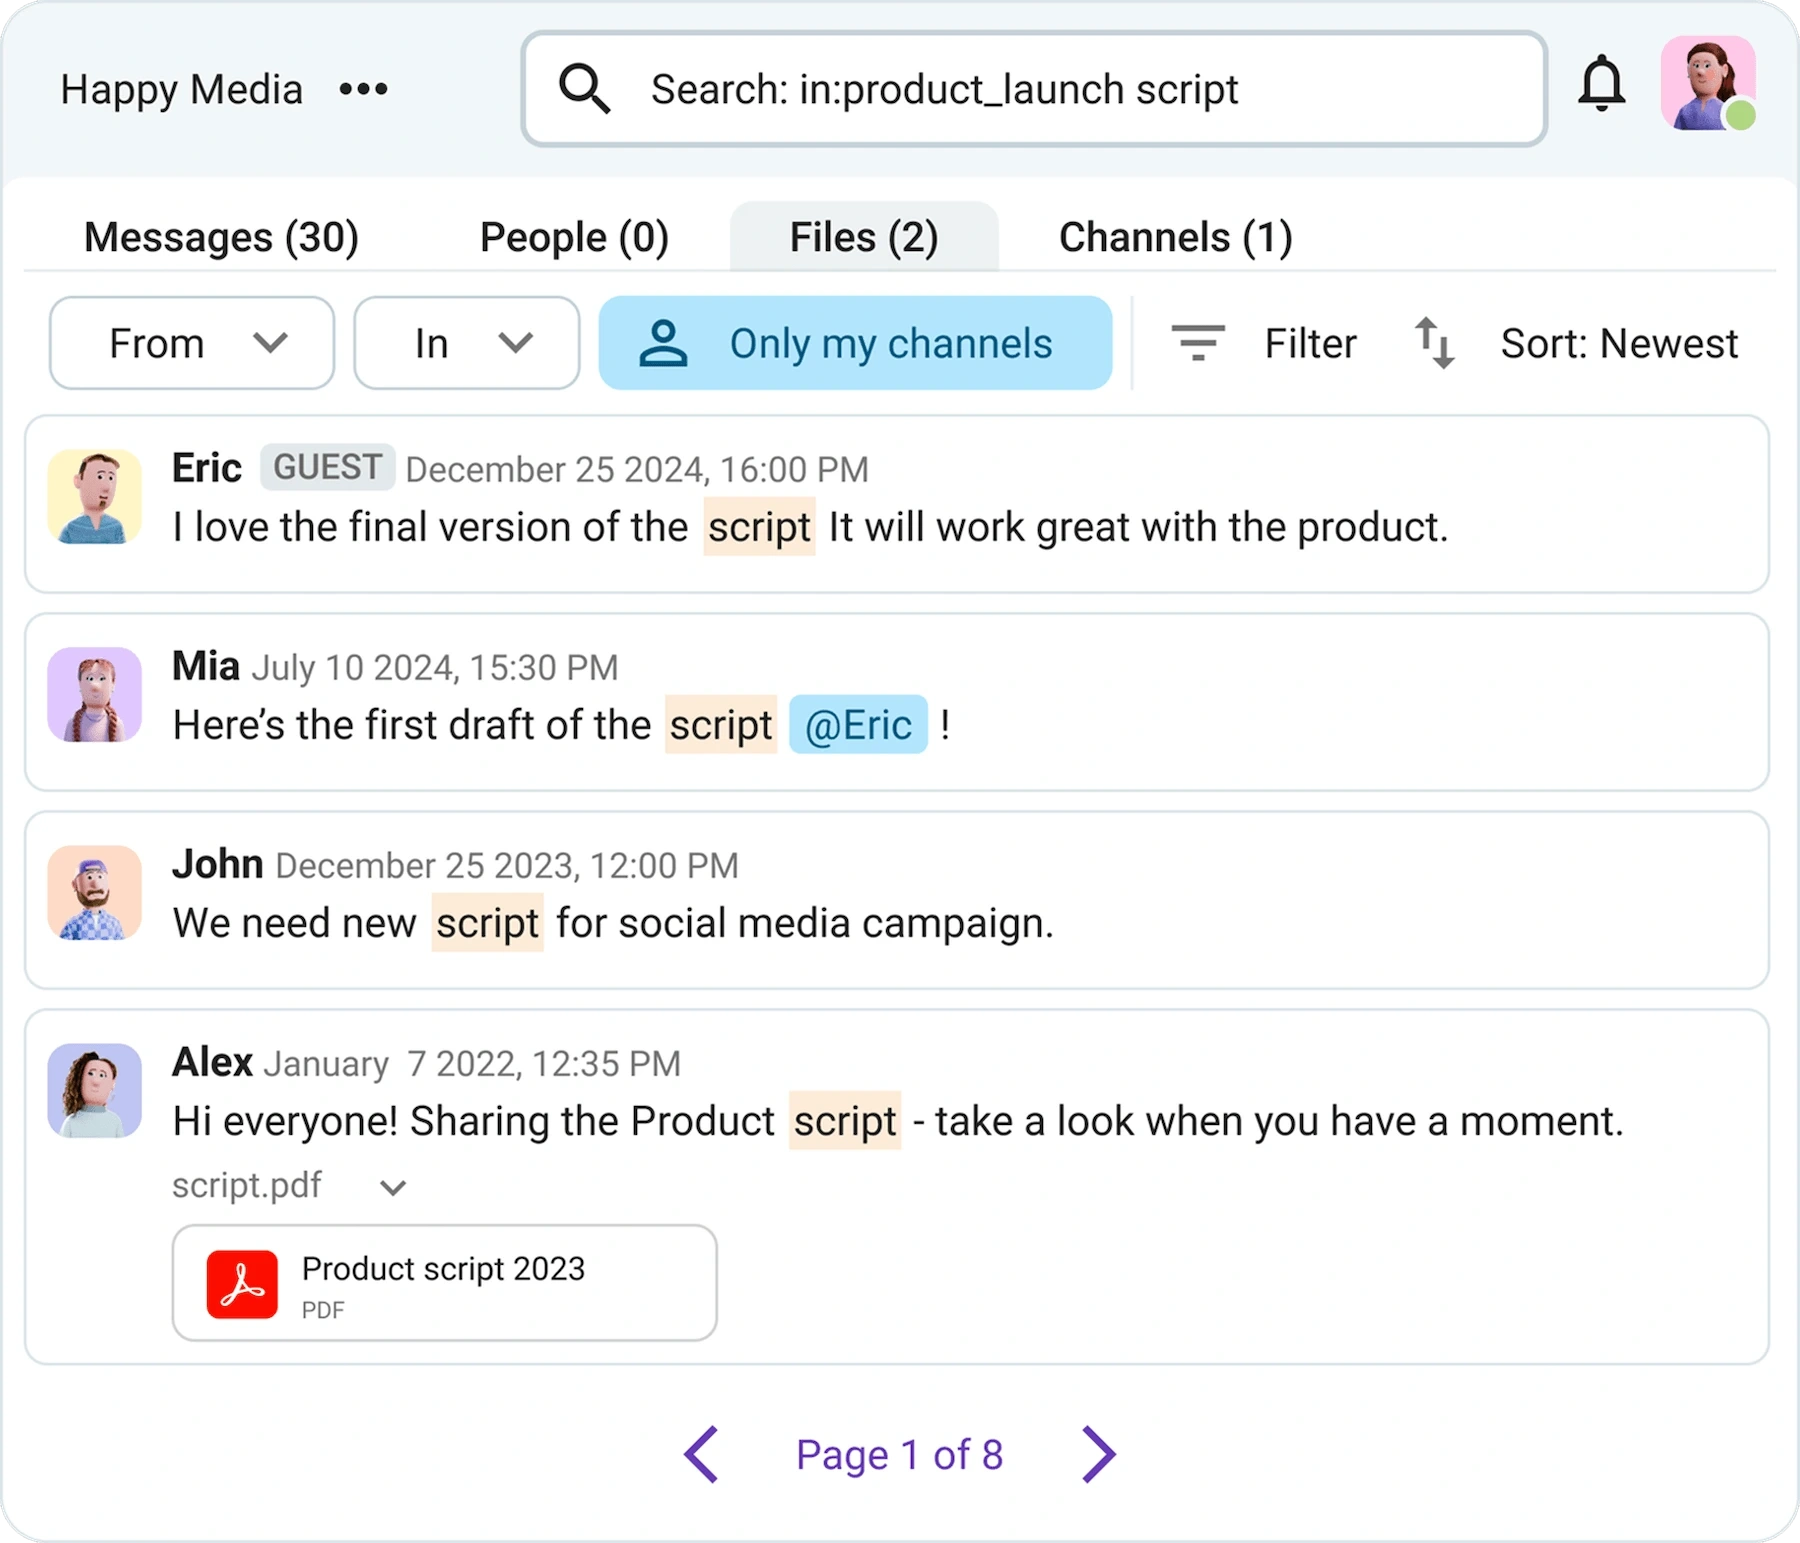
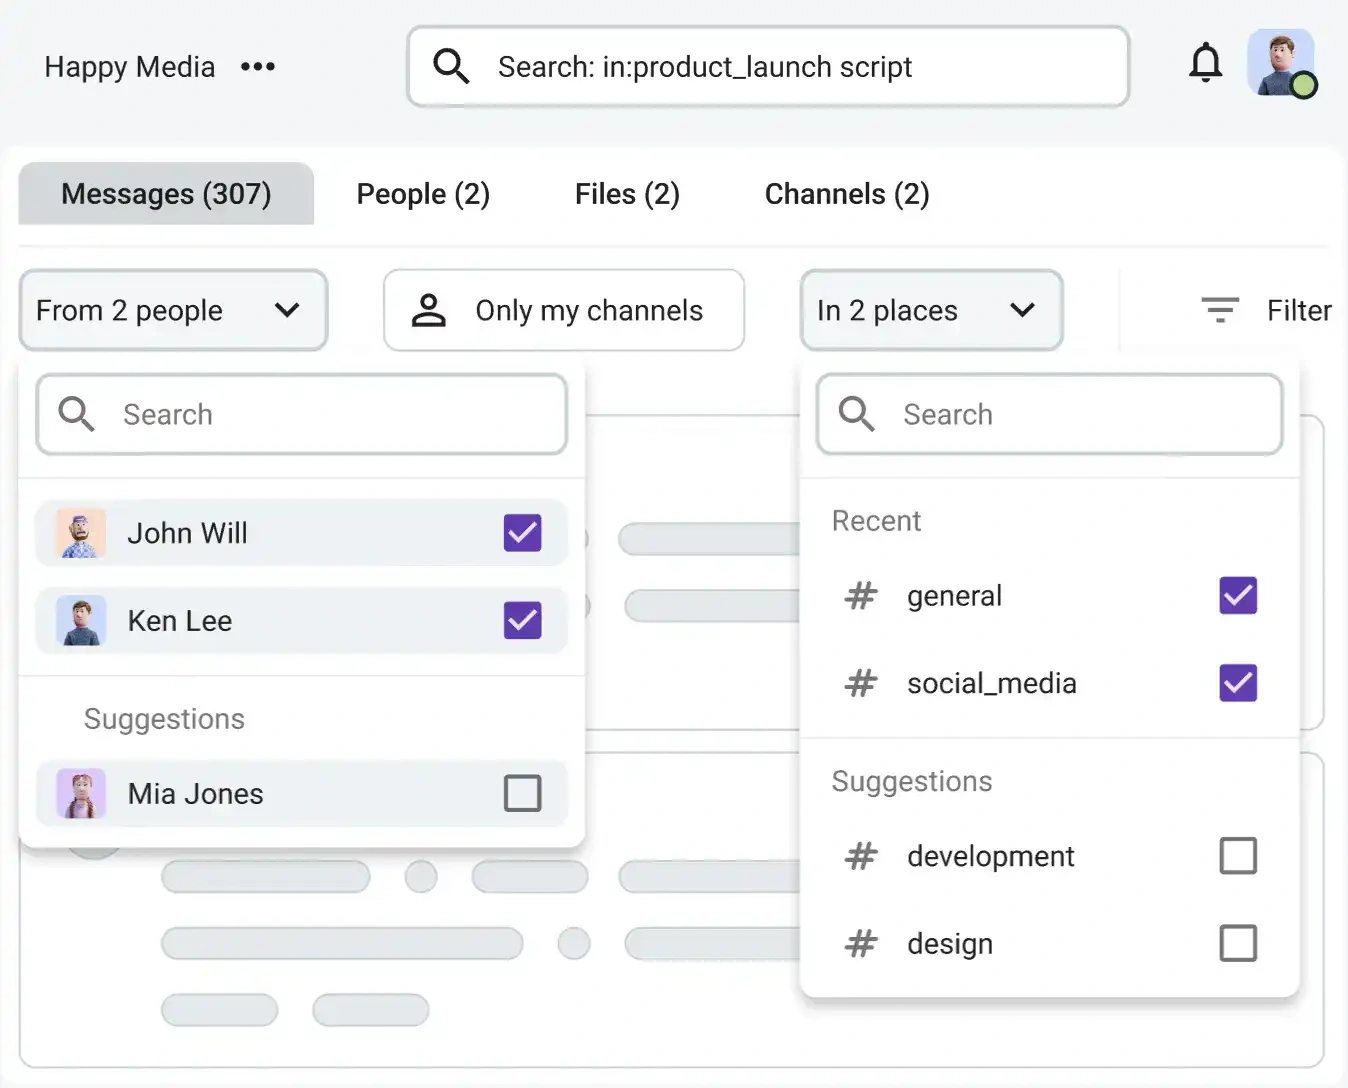
Since Pumble has an unlimited message history on all plans (including the Free plan), your knowledge base will always be accessible to you — it will never be deleted, even if you switch from a paying plan to a free one. All materials shared on Pumble — messages, images, videos, etc. — will be just one click away.

#3: Facilitating training and digital collaboration
Training goes beyond explaining processes to your new employees. That’s why it’s a good idea to employ additional visual aids that will ensure clarity and boost the overall efficiency of training sessions. The same aids can lend a helping hand during digital collaboration, and they can help bridge the gaps that appear due to the lack of face-to-face interaction. Here are a few examples:
- Screen recording videos — Similar to live video sessions, screen recordings allow you to walk new hires through complex digital tasks. You can also use meeting recordings of previous sessions.
- Annotations — Point out specific details on a visual (like a screenshot) or during live training or collaboration sessions. Annotations help the audience focus on exact details and improve understanding. Usually used during brainstorming and training sessions, as well as presentations.
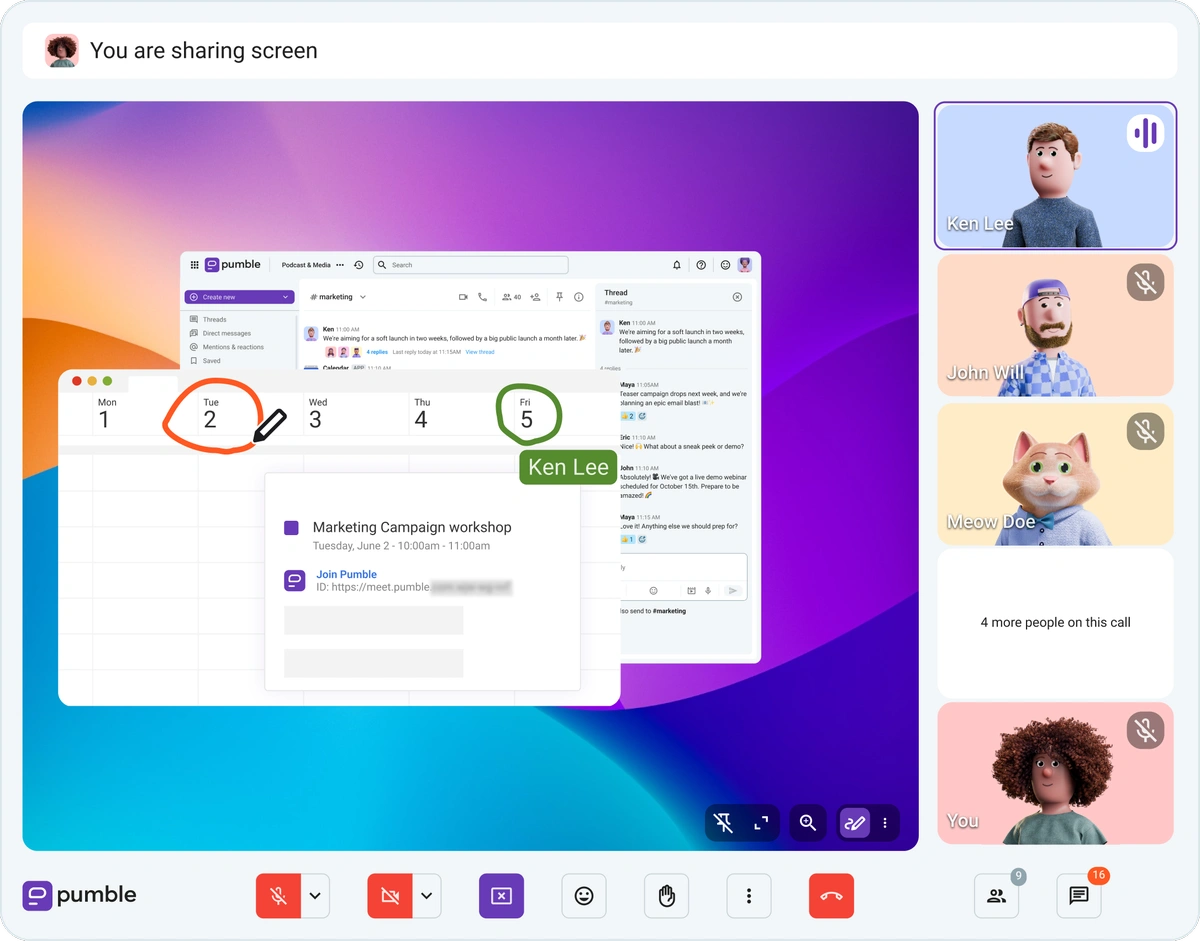
Hold training sessions on Pumble
Harness the power of visual communication with Pumble by CAKE.com
Visual communication is a necessity in the modern workplace, which is why you need a tool that will help you implement it.
A group messaging app by CAKE.com, Pumble allows you to send messages and share files of any size both in direct messages and channels. That means you can send images, videos, PDFs, GIFs, or any other visual that helps you convey your message.
And, since Pumble is also a video conferencing solution, it also allows you to hold meetings and presentations where you’ll be able to share your screen, annotate, and much more.
A true vessel of visual communication, Pumble is always there to help you express yourself.
How we reviewed this post: Our writers & editors monitor the posts and update them when new information becomes available, to keep them fresh and relevant.